
The Heat Is On. The Fourth of July Window Just Got a Lot More Interesting.
What the latest outlook means for retail demand, consumer spending, and public health.

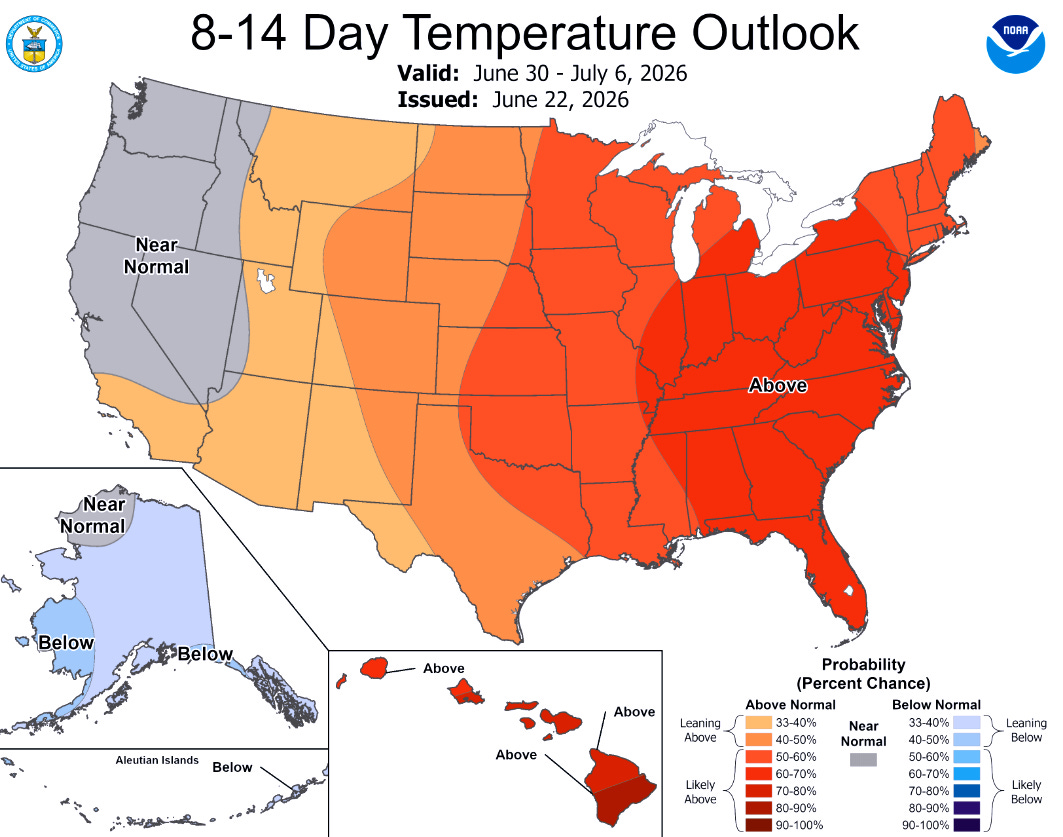
The updated 6-10 day outlook issued June 22 shows a powerful above-normal temperature signal building across the Central and Eastern US through June 28 - July 2. The Ohio Valley, Mid-Atlantic, and Northeast are now showing a likely above-normal temperature outlook — 80-90% probability in the core. The 8-14 day outlook extends that signal through July 6, well into the post-Fourth of July selling window.
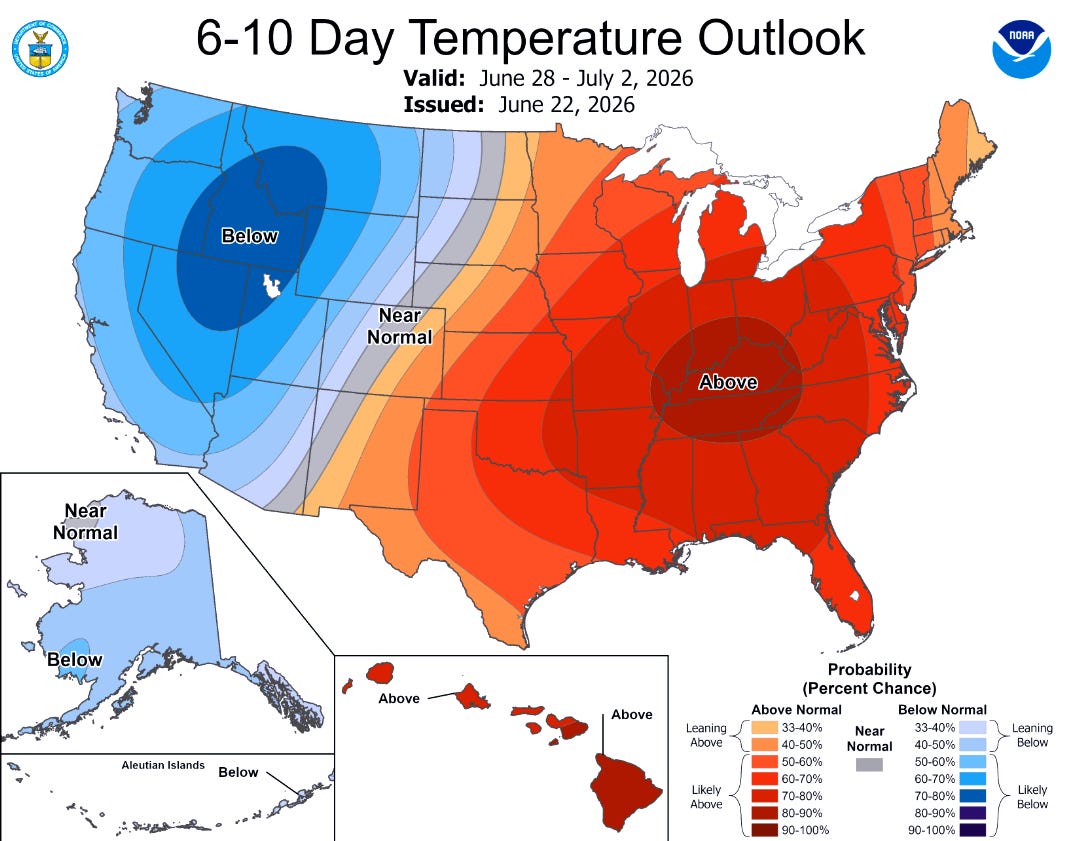
This is a heat event arriving just in time for the Fourth of July holiday weekend — lining up almost exactly with the anniversary of last June’s historic heat dome.
This is how the forecast system works. Longer-range outlooks establish the probabilistic envelope. Short-range forecasts fill in the details. The signal wasn’t absent before — it simply hadn’t resolved. Now it has.
The Anniversary Signal
Last June ranked 123rd warmest out of 131 years in the Northeast. The heat dome pushed Boston to 102 degrees, Philadelphia to 101, Newark to 103. Nearly 160 million Americans were under heat alerts simultaneously.
The current forecast is not last June. But the above-normal signal now building across the Northeast and Mid-Atlantic through the Fourth of July window — arriving as the Northeast returns to near-normal after a volatile spring and early summer — has the makings of a demand catalyst for cooling categories, outdoor recreation, and shore traffic.
The swing variable, as always, is the rain. Watch the precipitation outlook as the holiday weekend comes into the short-range forecast range.
What Last Summer Cost New York City
Last summer wasn’t just a retail story. It was a sustained public health emergency that ran from late June through mid-July.
The first event — June 22 through June 25 — was the most extreme. Central Park reached 99 degrees, breaking a record that had stood since 1888. JFK Airport hit 100 degrees for the first time since 2013. Newark hit 103. More than 150 million people across the Eastern US woke up to heat warnings.
Emergency departments in New York City reported 341 heat-related visits during the four-day event, with 141 on a single day — the highest one-day total since 2017. Nineteen people died. All but three were Black or Latino. Most died at home, without air conditioning.
That was just the beginning.
NYC experienced four separate heat waves over the course of the summer. A fourth heat wave arrived the week of July 11, with a Heat Advisory in effect July 16-17 as heat index values reached 100-104 degrees. By the end of the season, NYC finished 2025 as its fourth-warmest year on record and its second-hottest summer on record.
The NYC Health Department's 2026 annual report found that approximately 500 New Yorkers die from heat-related causes each year — most from chronic conditions worsened by heat. Of those, deaths from direct heat stress are far rarer.
Last summer's June heat wave alone caused 19 of them — well above the annual average of five — and disproportionately affected Black and Latino New Yorkers.
As the Fourth of July heat signal builds across the Eastern US this week, both lenses matter.
AI-First Health Resilience — At the Speed of a Heat Wave
Those deaths are preventable. Last summer’s heat events showed what prevention looks like when technology moves at the speed of the forecast.
ERaaS Health, founded by Samrat Kulkarni, is developing AI-first health intervention tools specifically targeting heat-related illness and mortality risk. I serve as an advisor to the company. During last summer’s heat events, ERaaS demonstrated what proactive, technology-enabled intervention can look like in practice.
Through scalable outreach, the system moved from data to proactive intervention in under 24 hours — identifying at-risk members, initiating rapid engagement via an AI agent, and seamlessly surfacing escalations to health plan care teams for targeted support, including wellness checks, cooling center referrals, and emergency interventions.
Every interaction was captured in real time, creating a closed-loop system connecting escalation detection, rapid outreach, and outcome tracking.
The results among engaged members were striking: a 47% reduction in ER and inpatient admissions, 9 out of 10 members’ call satisfaction, and an estimated 5-to-1 return on investment.
As heat events become more frequent and more severe — in the US and globally — the need for this kind of proactive, technology-enabled health resilience infrastructure moves from an interesting idea to a critical public health imperative. The ERaaS model points toward what that infrastructure looks like at scale.
What July Is Showing
The NOAA Official 30-Day Forecast, issued on June 18, covers the full month of July. It tells a tale of two coasts — and significant uncertainty in between.
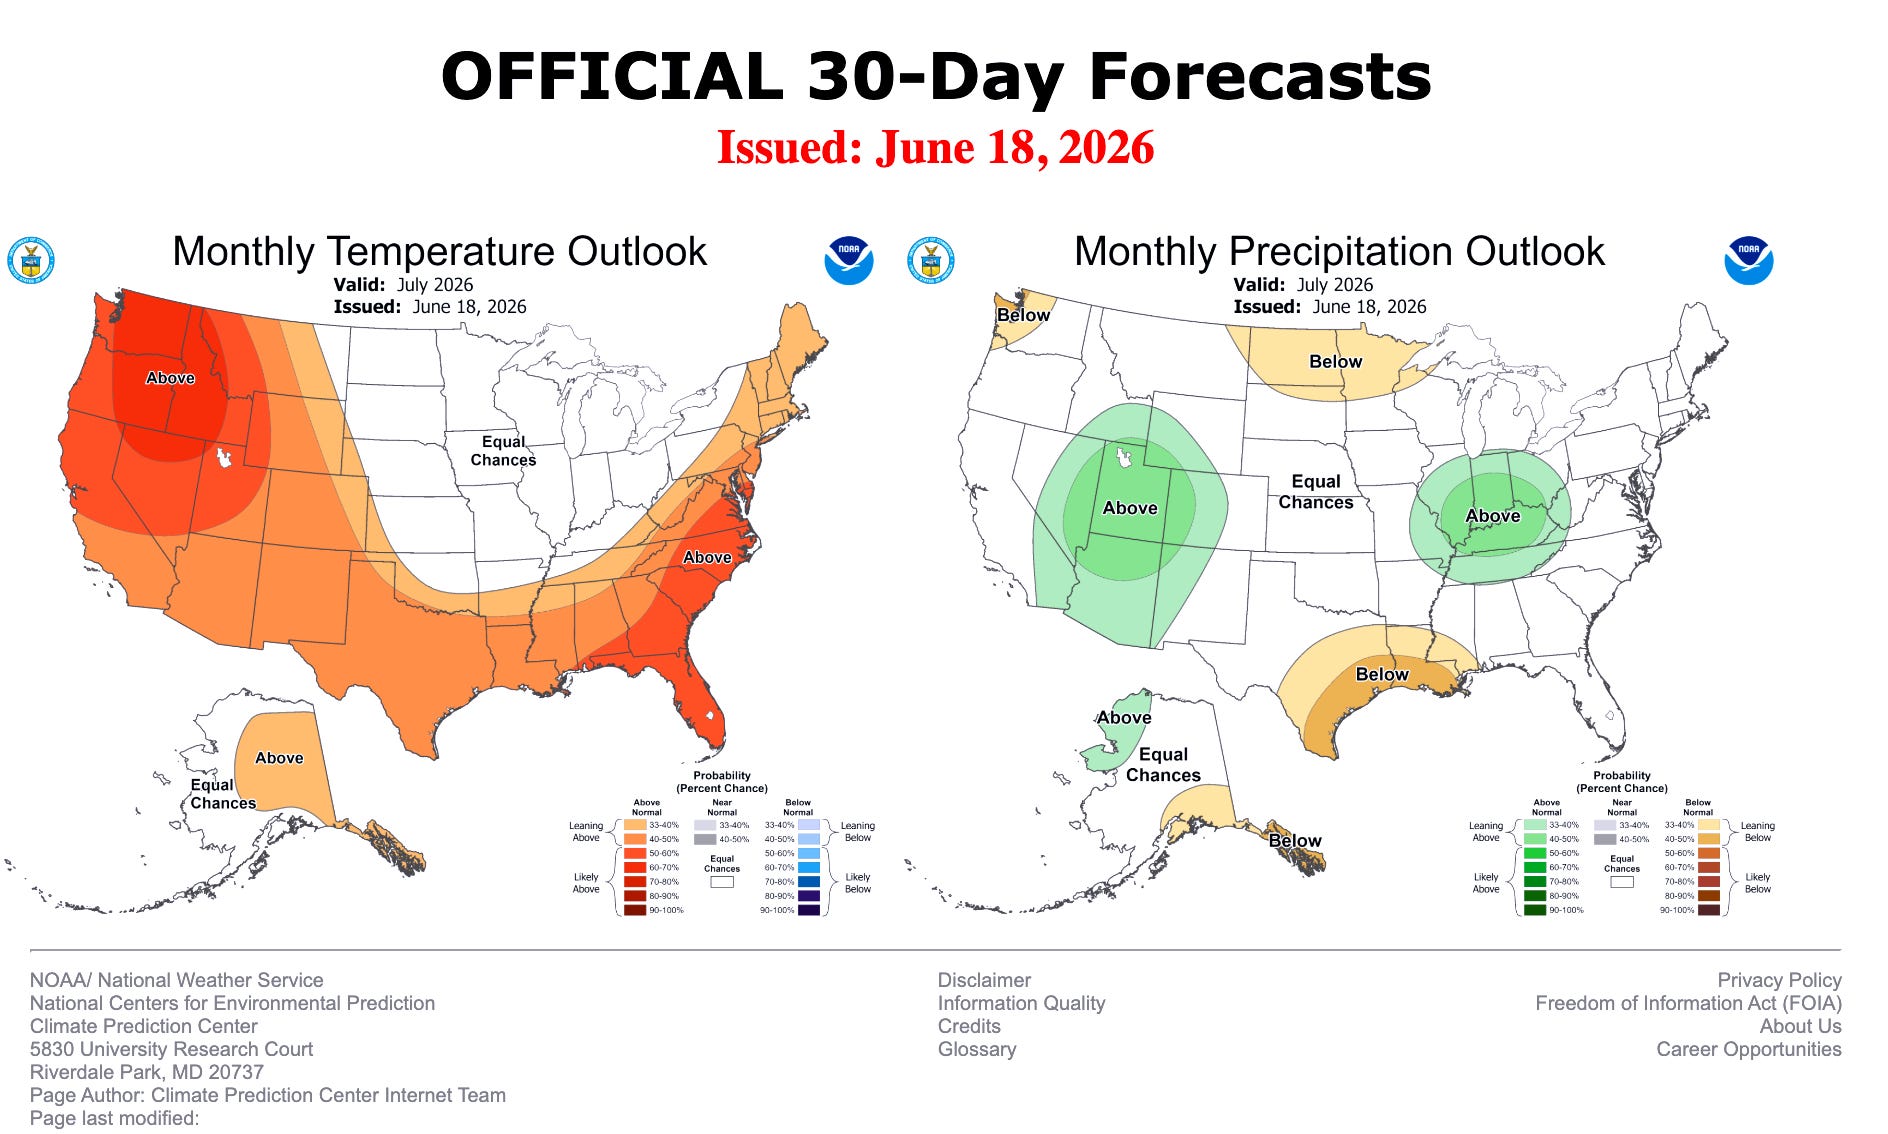
The West carries a strong above-normal temperature signal — likely above normal across the Pacific Northwest, California, and the Rockies, with 70-80% probability in the core.
For Seattle and Portland, already structurally underprepared for sustained heat, this is the signal that matters most for health risk and cooling demand.
The East is more nuanced. The Mid-Atlantic and Southeast show a modest warm lean. New England and the Great Lakes sit in Equal Chances for the month as a whole. That is not a strong demand driver against last summer’s sustained heat pattern — but it is not a cold signal either.
The precipitation map adds the swing variable.
Above normal precipitation is forecast across the Ohio Valley and into the Central Appalachians through July. Warm and wet conditions suppress outdoor demand even when the temperature signal is positive.
The coastal Northeast — where shore traffic and outdoor recreation demand concentrates during the Fourth of July window — sits in Equal Chances, which is the better news in this map for retailers with exposure to that geography.
July outlooks carry more uncertainty than short-range forecasts — this is normal for summer at the monthly range when large-scale atmospheric patterns are less persistent than in winter. The directional signal is consistent with what the short-range maps are already showing: above normal in the West, modest and uncertain in the East.
One event around the Fourth of July does not replicate the sustained demand effect seen last summer. How the pattern evolves over the rest of July will signal whether retail results hold up against last summer’s historic comparison.
The Consumer Headwind That Won’t Move
To materially move consumer behavior in summer, you need roughly two standard deviations from normal sustained over weeks. Last June, cleared that bar by a wide margin. The current forecast is above normal — but not yet at the outlier threshold that generates the demand surge retailers need to lap last year’s results.
And the consumer absorbing this heat is not the same consumer who carried last summer. Electricity prices are elevated — driven by the Iran conflict, which is pushing energy costs higher, and by structural demand from AI data centers competing for the same grid capacity.
A heat wave that drives around-the-clock air conditioning use is not just a demand driver for cooling products. It is a direct wallet squeeze on an already financially stressed consumer. Every dollar going to the electricity bill is a dollar not going to discretionary retail.
Heat plus high electricity costs is a consumer squeeze, not a clean demand driver.
Europe Is Already There
While the US watches a heat signal build for the Fourth of July window, Western Europe is already in the midst of it.
Temperatures in parts of France exceeded 104 degrees Fahrenheit this week, drawing comparisons to the catastrophic 2003 heat wave that killed 70,000 people across the continent. Britain’s Met Office issued extreme heat warnings. France put much of the country under red-level alert.
The New York Times reported this morning that of France’s 52 official heat waves since 1947, half have occurred in the past 16 years — an acceleration that epidemiologists are directly linking to climate change. “We have adapted, but it is far from enough for what is coming,” said Pierre Masselot of the London School of Hygiene & Tropical Medicine.
Europe built early warning systems and cooling shelters after 2003. They helped. But air conditioning penetration remains low — roughly 25% of French homes have cooling units. And the absolute number of senior citizens across the EU has risen by 40% over the past two decades, expanding the most vulnerable population at the same time that heat waves are accelerating.
This is the crash test, as one French epidemiologist put it. The preparation has helped. It has not solved the problem.
The Fingerprints of Climate Change
The European heat wave and the building US heat signal are not unrelated weather events. They are fingerprints of a warming climate system in which extreme heat events are becoming more frequent, more intense, and more economically and medically consequential.
El Niño adds a natural amplifier atop an already warming baseline — raising the ceiling on what extreme heat events can deliver this summer and into the winter season.
The 2021 Pacific Northwest heat dome killed hundreds in a region structurally unprepared for sustained heat. The 2003 European heat wave killed 70,000. Last June’s US heat dome put 160 million Americans under heat alerts. This week, Europe is in the middle of its next major test.
The G2 Weather Intelligence Signal
For retailers: the Fourth of July heat signal is real and building. Cooling categories, outdoor recreation, and shore traffic may get a demand boost. But watch the precipitation outlook — rain is the swing variable — and don’t mistake a one-week heat event for the sustained two-standard-deviation anomaly that drives the kind of July surge the retail home sector saw last year.
The weather backstop that carried spring retail sales performance is still absent at the macro level. This heat event is a local and temporal signal, not a national tailwind.
Musical Coda
© 2026 G2 Weather Intelligence. All rights reserved.