

Summary View
A super El Niño is now the base case for winter 2026-27. We're in the first week back after Labor Day, the unofficial start of fall, and the season's reality is starting to come into focus.
NOAA’s Climate Prediction Center has steadily raised its confidence in a “very strong” El Niño, from 63% in June to over 90% as of its August 13 update. It’s also giving 69% odds that this event sets a new record dating back to 1950.
The World Meteorological Organization went further in its September 3 update, putting the odds of El Niño conditions this fall at essentially certain. WMO expects the event to keep intensifying through November and December.
This isn’t a forecast that’s softening as the season approaches — it’s hardening.
Key takeaways:
Nearly half of US retail households (48%) sit in regions I estimate carry a 70-90% probability of running warmer than last winter — the comparison retailers actually plan against, not the 30-year normal NOAA’s own maps default to.
That warm-comparison risk concentrates in the Northeast, Ohio Valley, and Upper Midwest — the three highest-density retail markets in the country — because last winter (La Niña) ran unusually cold there. This year (El Niño) inverts the pattern.
Historical precedent (1997-98, 2015-16) shows the national retail number typically comes out fine or better — but cold-weather apparel takes a sharp, concentrated loss in the exact seven-to-eight-week holiday window, a loss that doesn’t average out against a good aggregate quarter.
I’m flagging major weather-driven demand risk in specialty apparel and seasonal apparel in general for the companies that do not have an active weather strategy in place.
TJX, Home Depot, Lowe's, and Walmart/Target screen as relatively insulated, for different reasons tied to assortment mix and geographic store distribution.
A Note on Probability
A few weeks ago, my family and I went to a Phillies game. We had great seats on the first-base line, in the semi-swank Hall of Fame Club. The weather was beautiful. A perfect day for baseball.
Except the Phillies didn’t come to play (or so it seemed). They were sluggish through eight full innings and down 4-0. No one was hitting.
Odds were 99.6% that they would lose, and it was a sold-out game … so we left to beat the traffic.
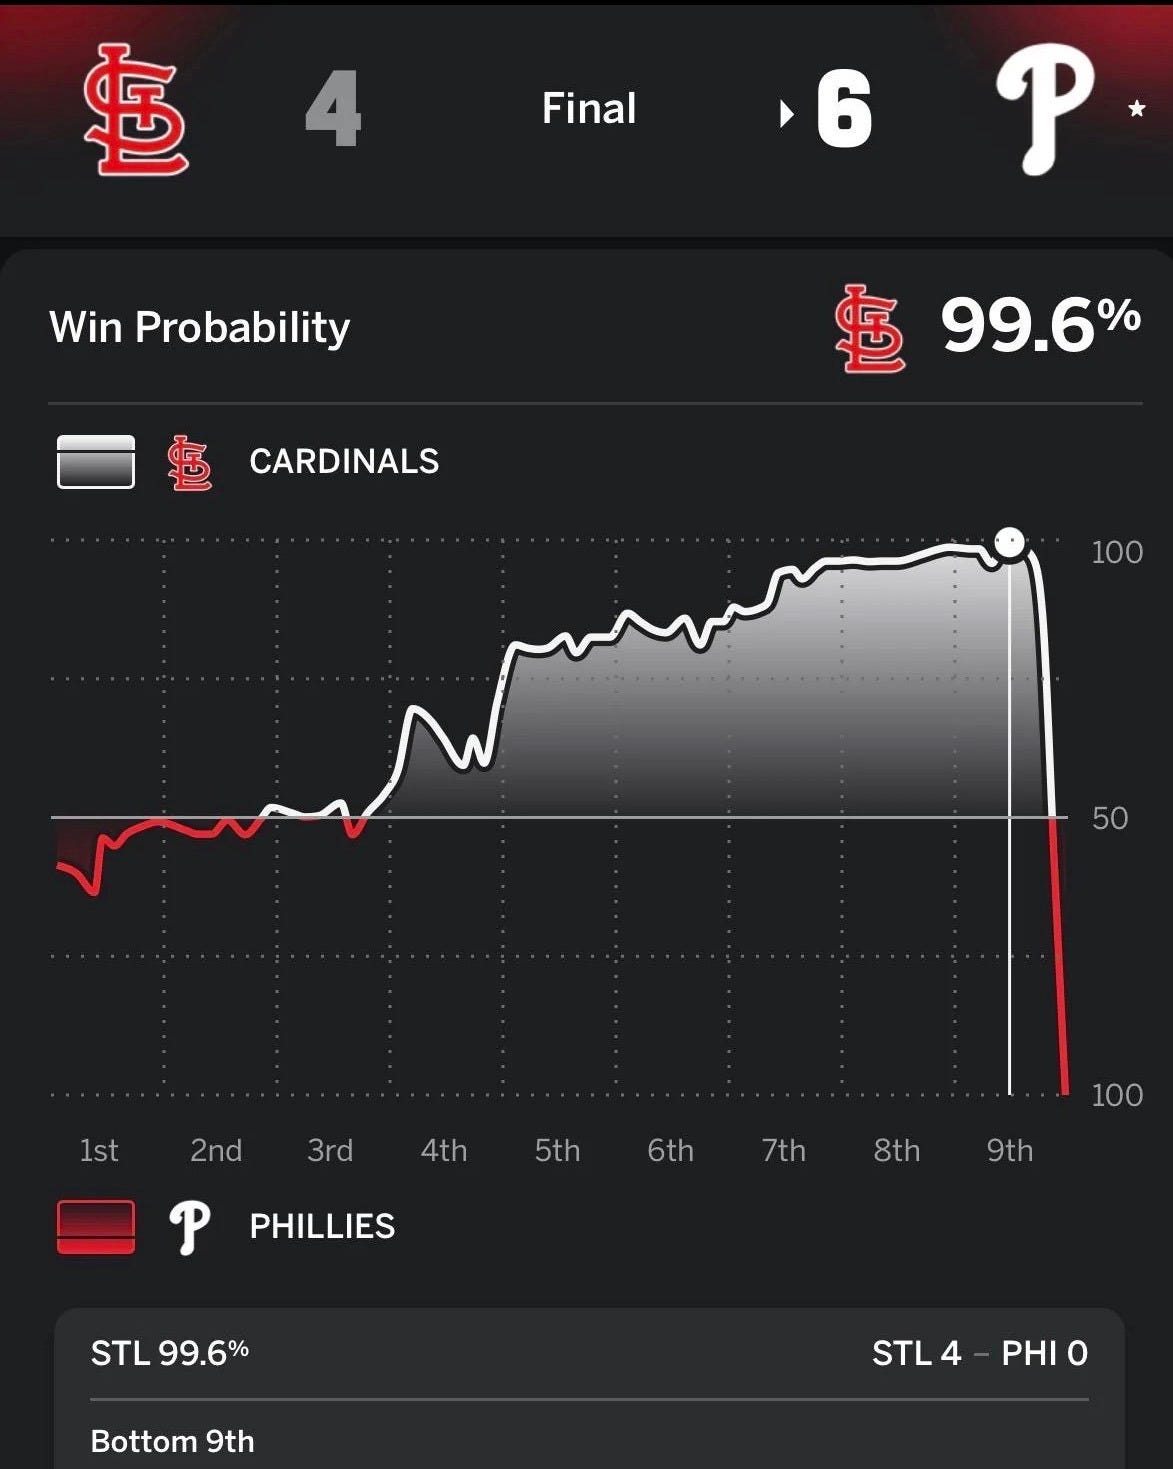
When we got home, I asked Alexa for the final score, expecting a 4-0 loss. Instead, it was Phillies 6, Cardinals 4. A spit-take ensued …
We'd missed a historic comeback. With two outs in the bottom of the ninth, the Phillies scored six runs and won the game. It was a historic win.
And yet (and, yet!) I still maintain leaving was the right decision—despite the (extremely) unlikely outcome.
That’s the same discipline behind the odds in this report.
A 90% chance the Northeast runs warmer than last year, a 95% chance the Southwest runs colder. These aren’t guarantees, but they’re the right way to size a bet.
That means specialty apparel retailers and the seasonal apparel category overall face a real demand headwind this holiday season.
Of course, the super El Niño could still flame out, and we could see a colder winter with stronger apparel demand than last year across the densely populated East. But it would be a bad bet, bordering on malpractice, to count on that.
The Setup
Last winter was a weak La Niña. This winter is a full reversal to a Super El Niño, and NOAA’s confidence keeps climbing every time it updates. It isn’t weakening or plateauing.
This isn’t a marginal seasonal call. It’s one of the most confident long-lead forecasts NOAA issues at this time of year, and it’s still more than a month from the agency’s flagship October 15 Winter Outlook release, which should further firm the picture.
Retail has been through this before, twice at comparable magnitude.
In 1997-98, the strongest El Niño on record, the net macro effect came in positive — Changnon's 1999 analysis in the Bulletin of the American Meteorological Society estimated the national economic gains at approximately $19 billion, from lower heating costs, stronger home sales, and higher overall retail spending (Changnon, 1999).
But that headline number buried a real loss: clothing retailers in the northern states saw winter apparel sales decline, and outerwear vendors described the season as a washout.
In 2015-16, the last event of comparable strength, Planalytics measured $421 million in apparel losses in the first seven weeks alone, climbing past $500 million by December 26.
I covered that event from inside the industry — CNBC interviewed me at the time, and the piece named Lowe’s and Home Depot as beneficiaries of that season’s mild weather while apparel retailers wrote down inventory.
The pattern holds across both events: the national aggregate is not the risk. The risk is concentrated, seasonal, and category-specific, and it shows up exactly where cold-weather sell-through matters most.
Methodology Note
I’m combining two independent signals in this report.
Signal one is a directional forecast, built on each region’s weekly temperature departure from normal last winter, a weak La Niña. Since this winter is the opposite ENSO phase, I expect that departure to reverse, a reversion to the mean.
This is more than statistical convention. Last winter’s anomalies were driven by La Niña, and now that the pattern has flipped, the same mechanism should push each region’s temperature back the other way.
Signal two is NOAA’s actual November-December-January 2026-27 seasonal outlook, issued August 20, 2026 — the first release to reflect the August strength upgrade. This gives an official above/below/near-normal tercile probability by region. (NOAA CPC Seasonal Outlook)
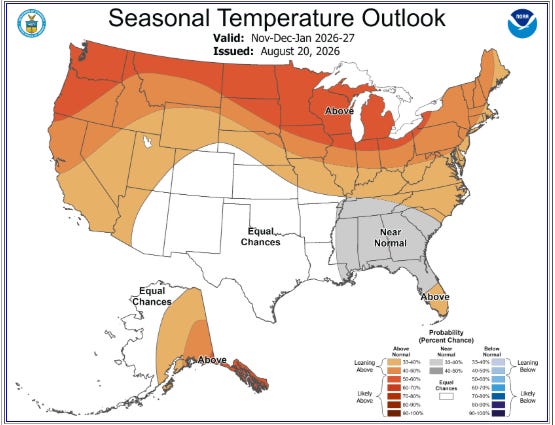
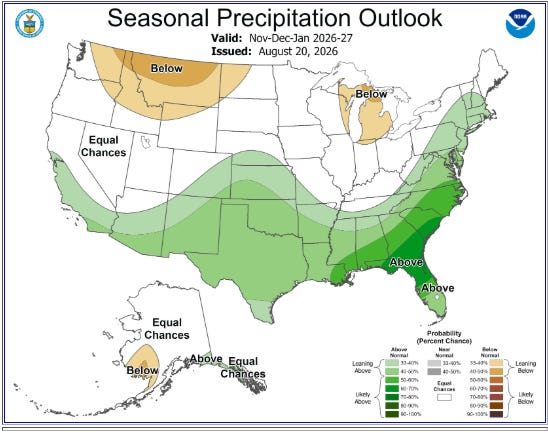
Combining the two: for each region, I take last year’s actual comparison-to-normal and NOAA’s current probability lean, and estimate the odds this winter runs warmer (or colder) than last winter specifically. That’s the number a retail planner actually needs, since forecasts and plans are often built against the prior year, not a three-decade average.
These combined odds are my estimate, not an official NOAA figure, built using a standard assumption about seasonal temperature variability. Treat the direction and rough magnitude as reliable; treat the specific percentages as illustrative.
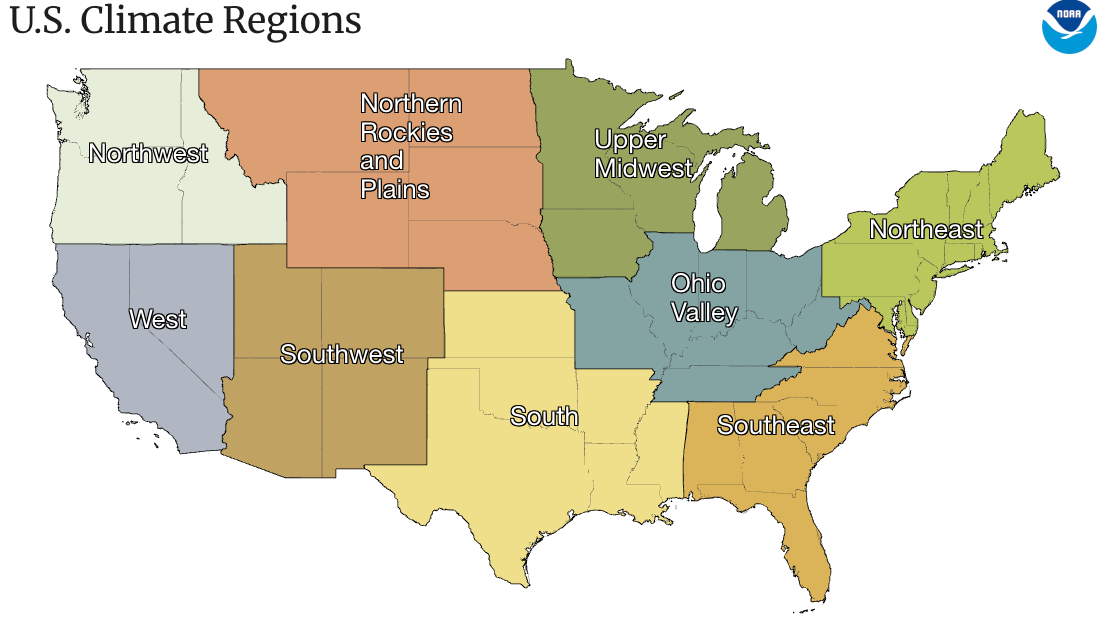
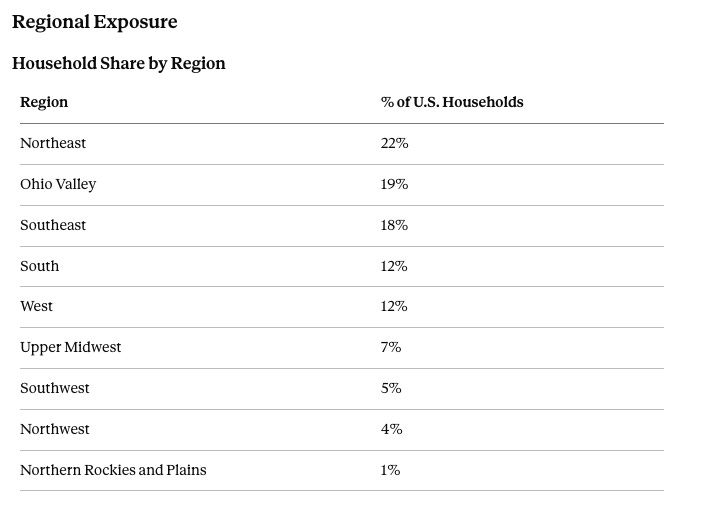
Regions follow NOAA's standard breakdown: Northeast, Upper Midwest, Ohio Valley, Southeast, Northern Rockies and Plains, South, Southwest, Northwest, West.
Warmer or Colder Than Last Year — Three-Group Odds
Nov-Dec-Jan 2026-27 vs. NDJ 2025-26
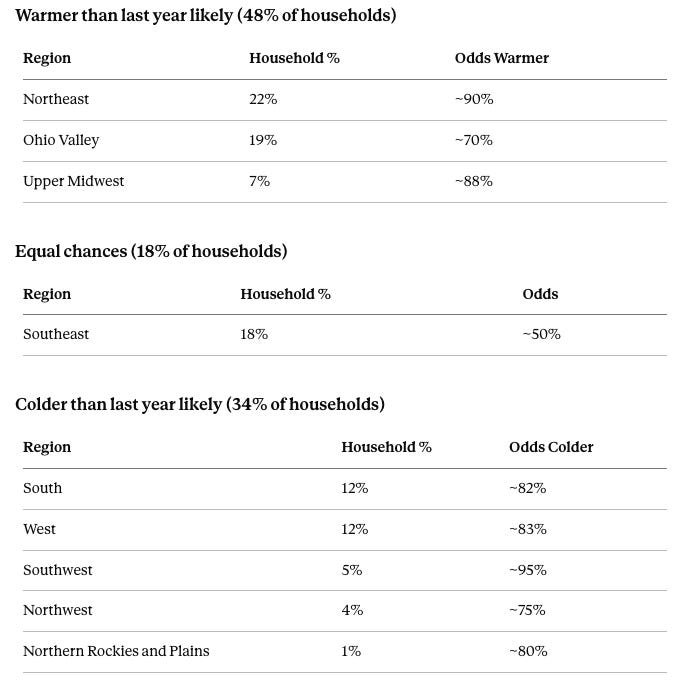
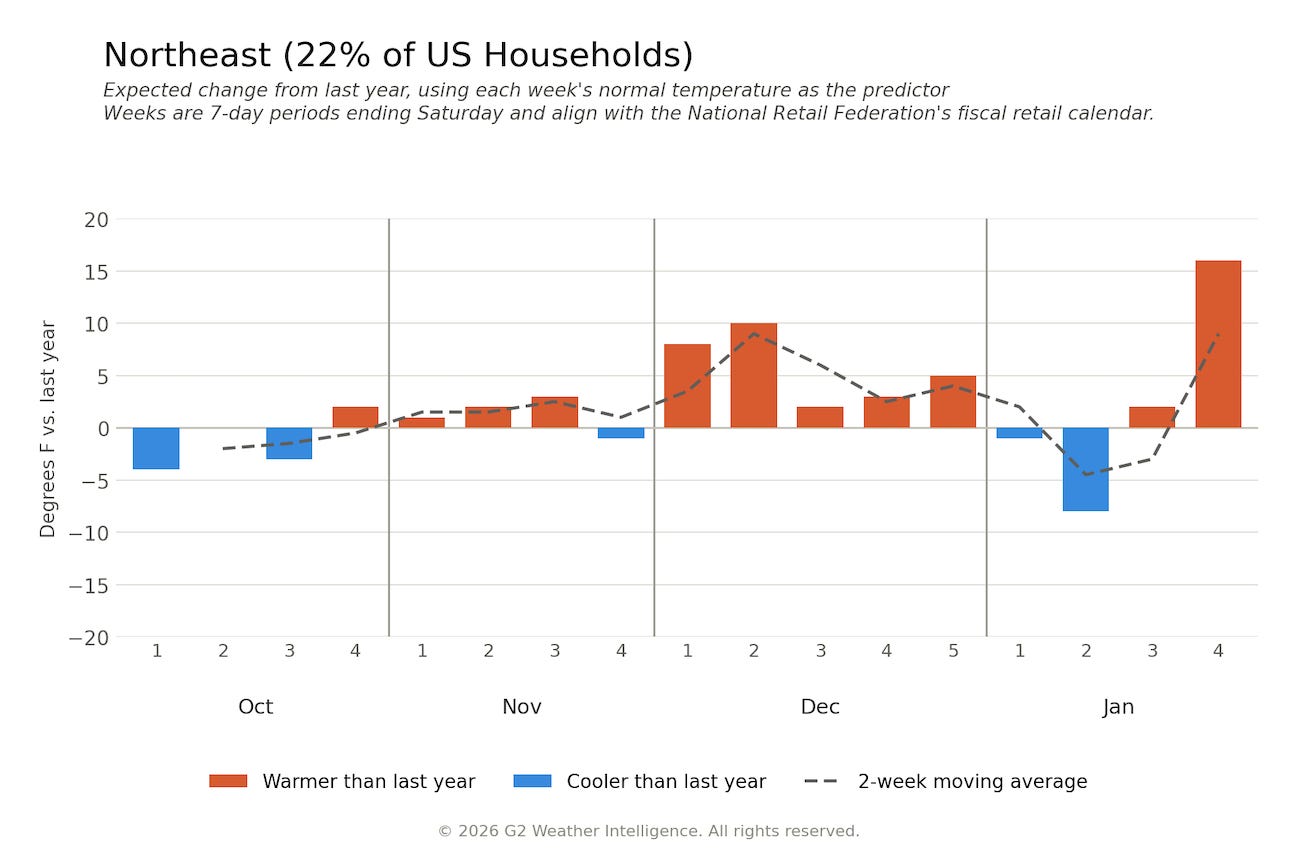
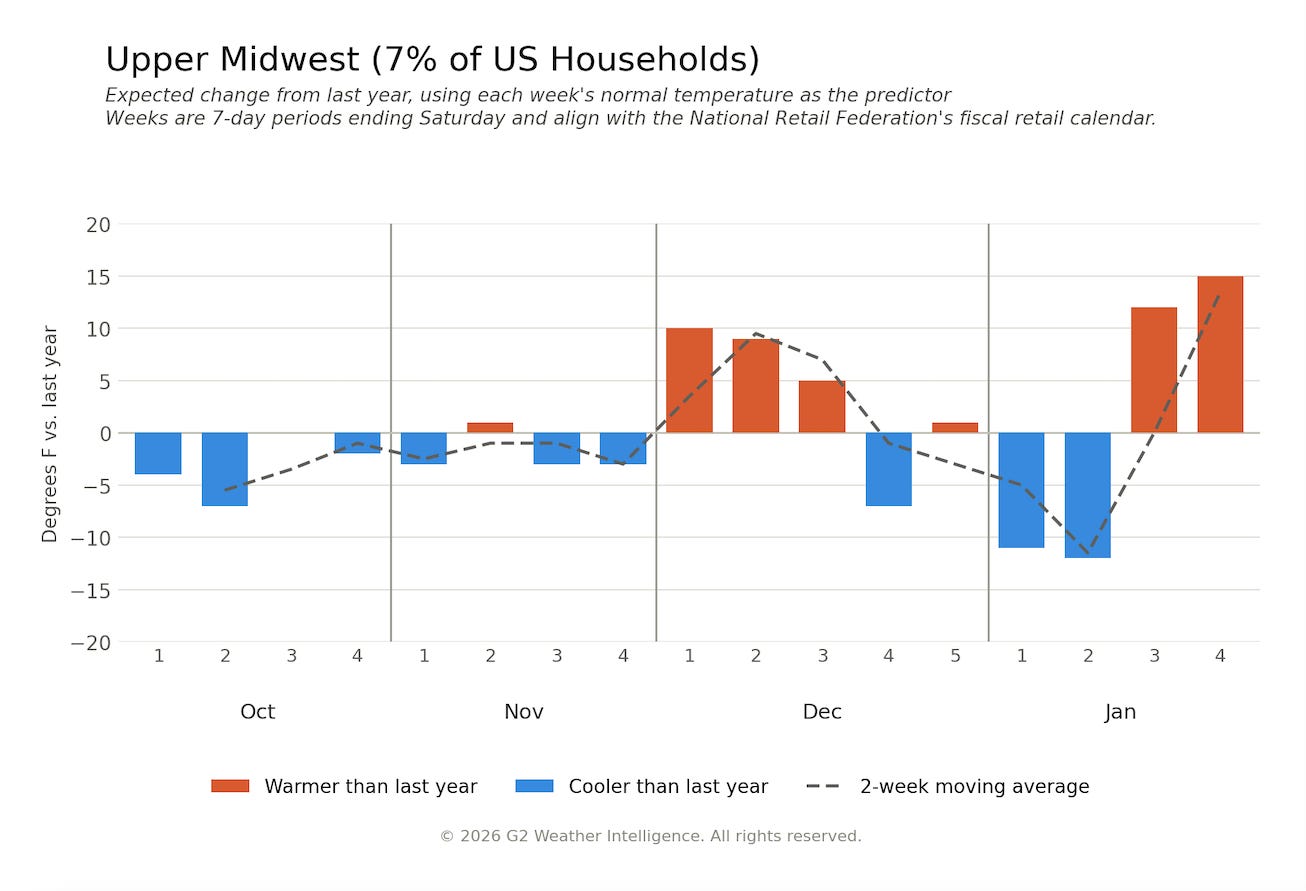
NOAA’s own maps show the strongest raw above-normal confidence in the Northwest and Great Lakes. But the Northeast — 22% of US households on its own — carries the single highest odds of a warmer year-over-year comparison in the entire dataset, because it’s coming off the coldest prior-year base.
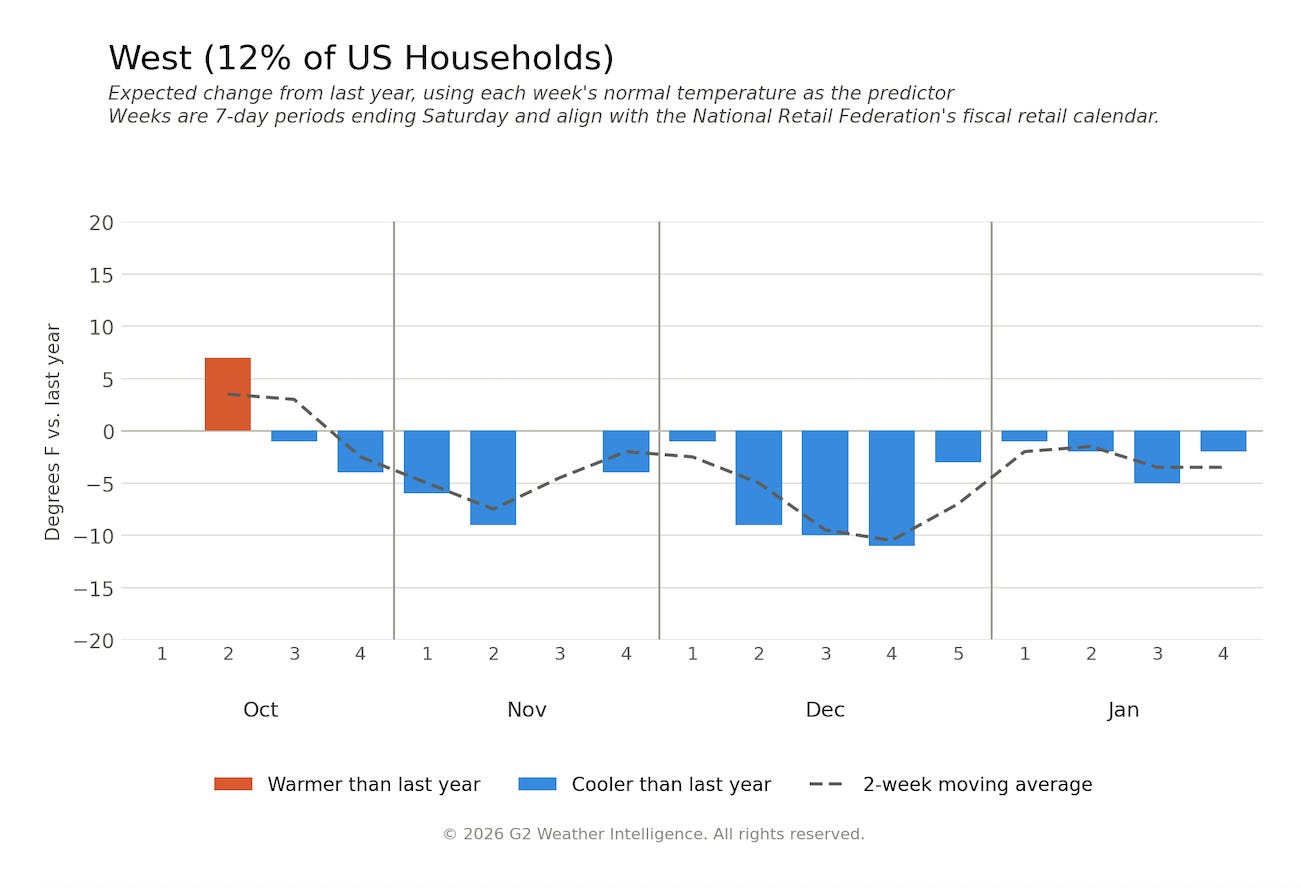
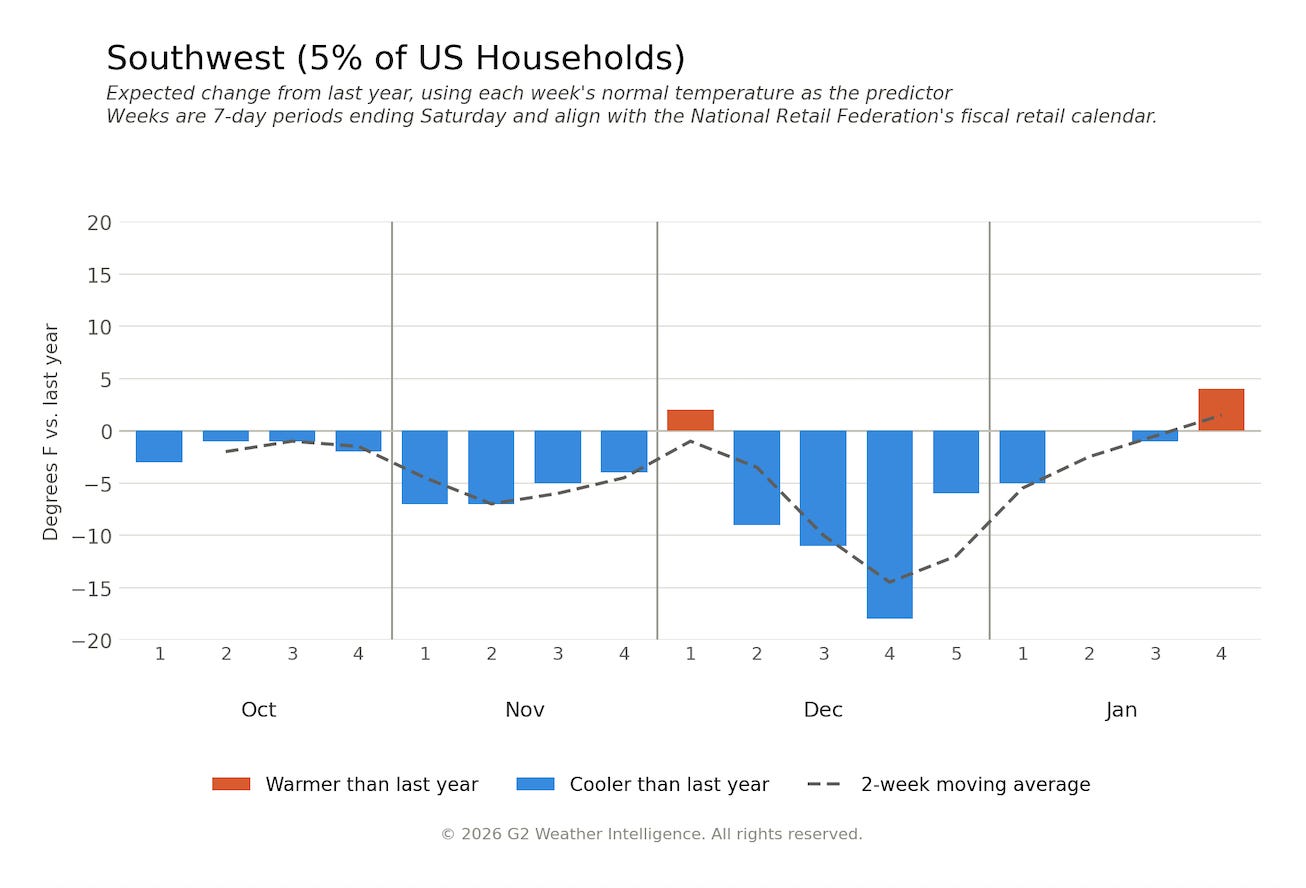
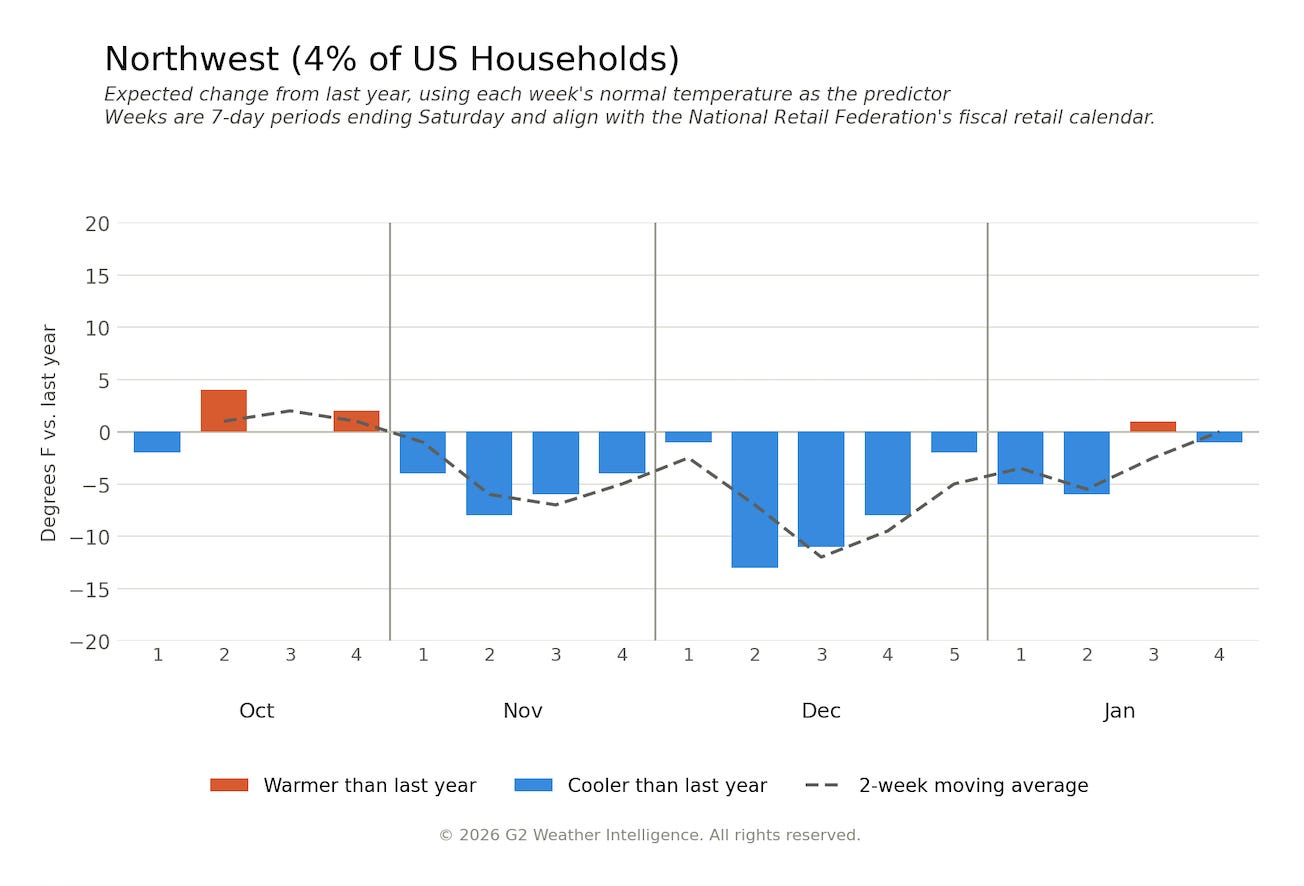
The West, Southwest, and Northwest show the inverse: a strong absolute warmth signal and weak year-over-year comparison risk, because last year was already mild there. Read NOAA’s map alone, and you’d miss this entirely.
The comparison is the story, not the normal.
Company Exposure
Specialty apparel and department stores across the Northeast and Midwest are facing real headwinds this fall/holiday season.
Gap (Old Navy) and Kohl’s are the two names I’m calling out directly, but they’re not the only ones exposed. Both carry direct demand risk on the same weather thesis, in the same season.
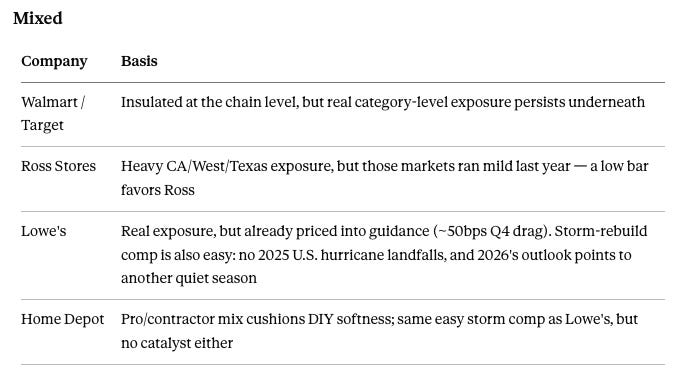
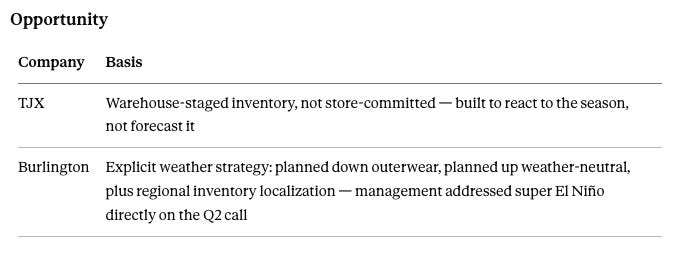
Everyone else in this table is either structurally insulated or actively managing the exposure.
TJX’s Ernie Herrman and Burlington’s Michael O’Sullivan are, so far, the only two retail executives to address “super El Niño” directly on their Q2 2026 call, a sign that the more sophisticated merchants are already pricing this in..

What Would Change This Call
This is a directional, probabilistic thesis, not a certainty. A few things would meaningfully revise it:
NOAA’s October 15 Winter Outlook is the next scheduled update and will reflect the full August strength revision for the first time in the flagship product. A material shift in regional confidence there would flow directly into the odds table above.
This method assumes each region’s temperature this winter mirrors last winter’s opposite ENSO phase. That’s a reasonable heuristic at this lead time, not a physical forecast, and actual conditions can deviate from a clean reversal, especially in weaker-signal regions like the Southeast.
Earnings commentary is a leading indicator worth tracking in real time. Burlington’s Q2 call showed a genuinely cold-weather-exposed retailer volunteering this risk in depth, rather than waiting to be asked the way TJX was — worth watching whether other exposed names follow that lead in Q3 reports.
Appendix: Regional Detail
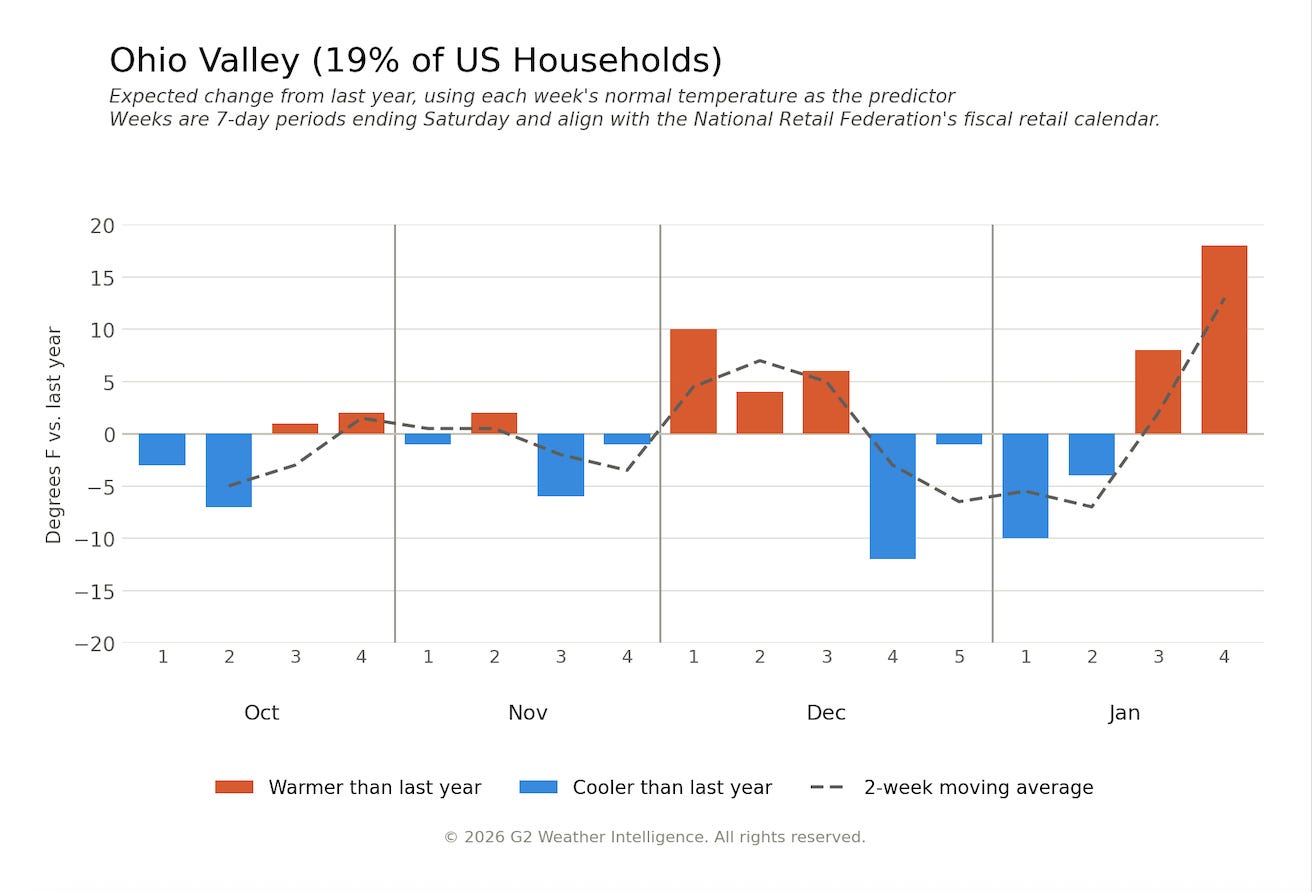
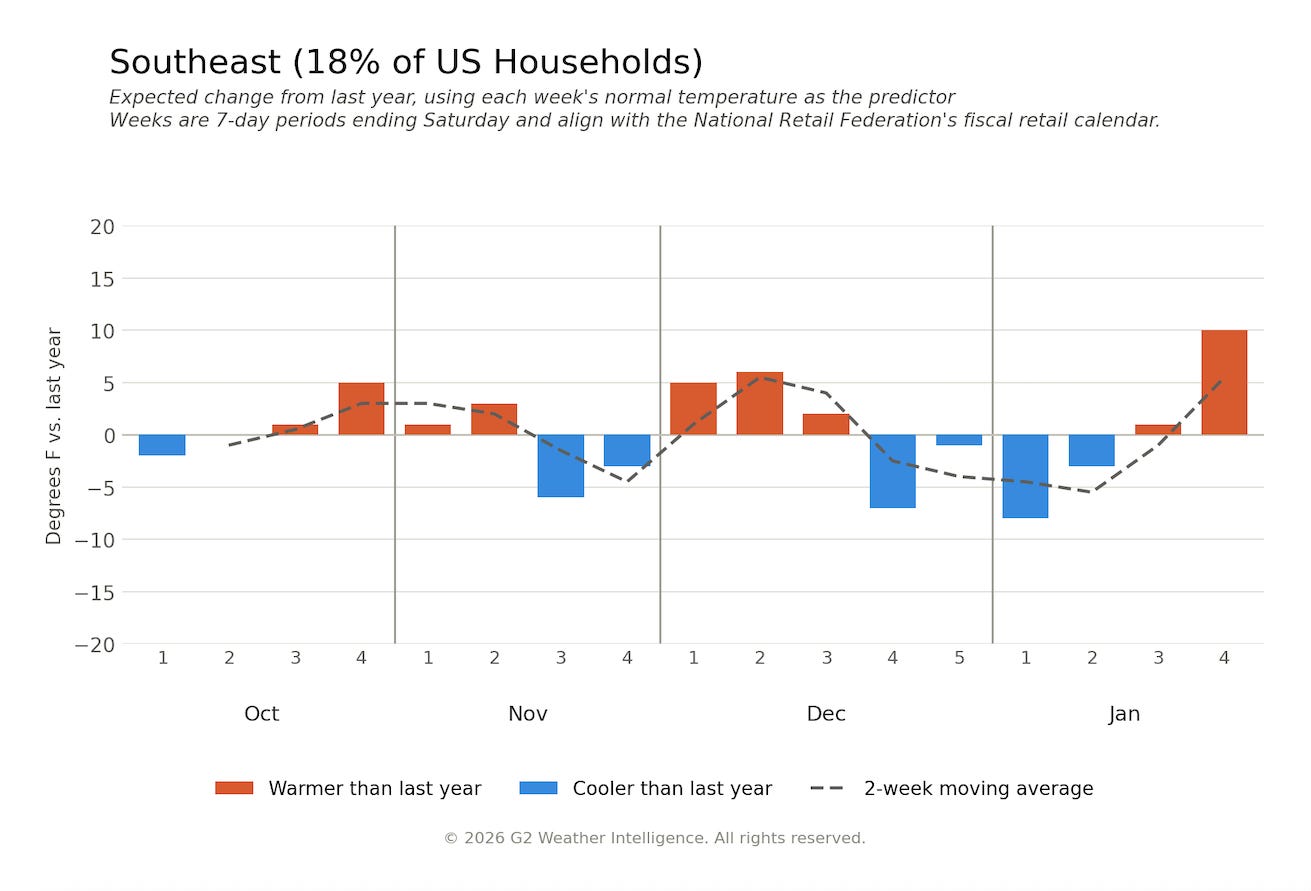
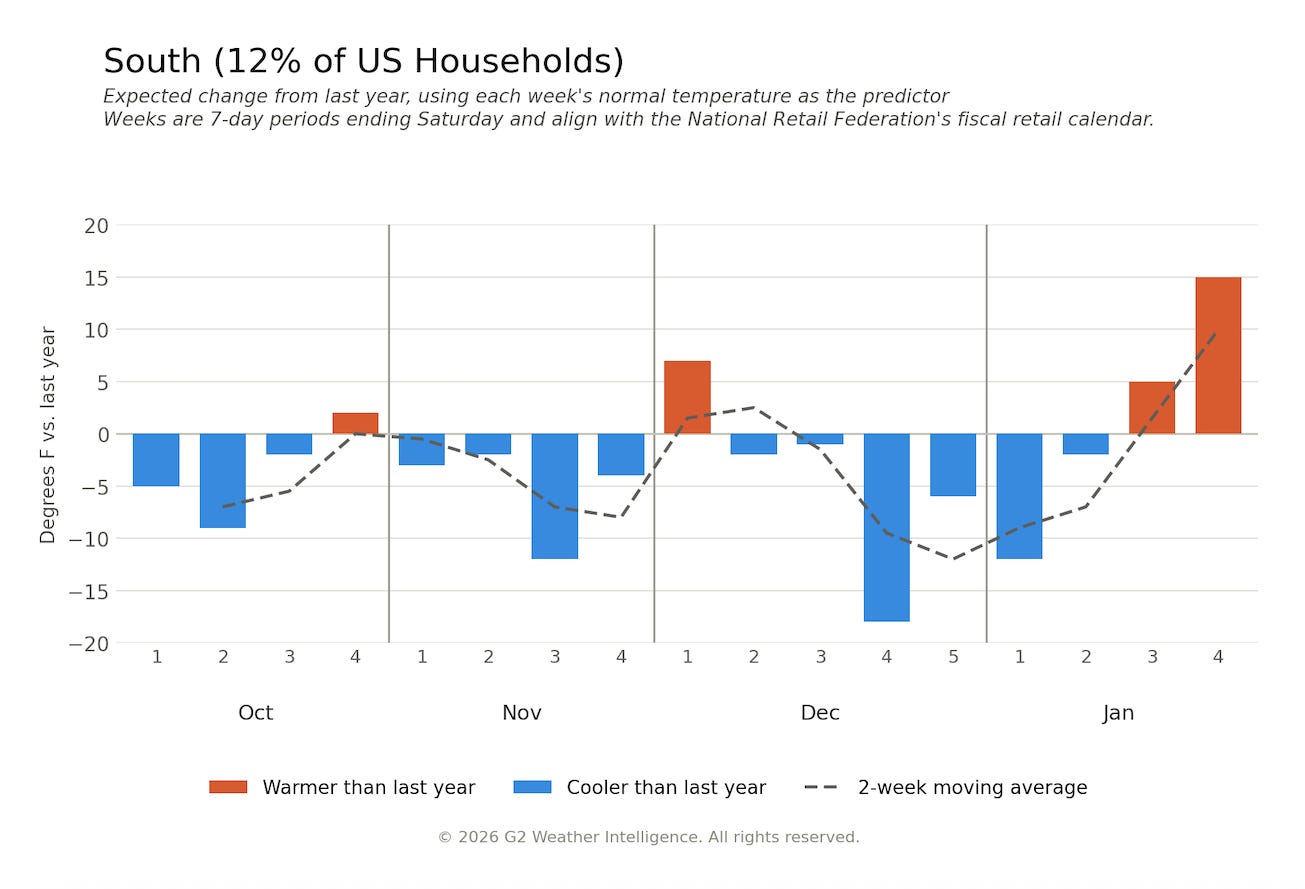
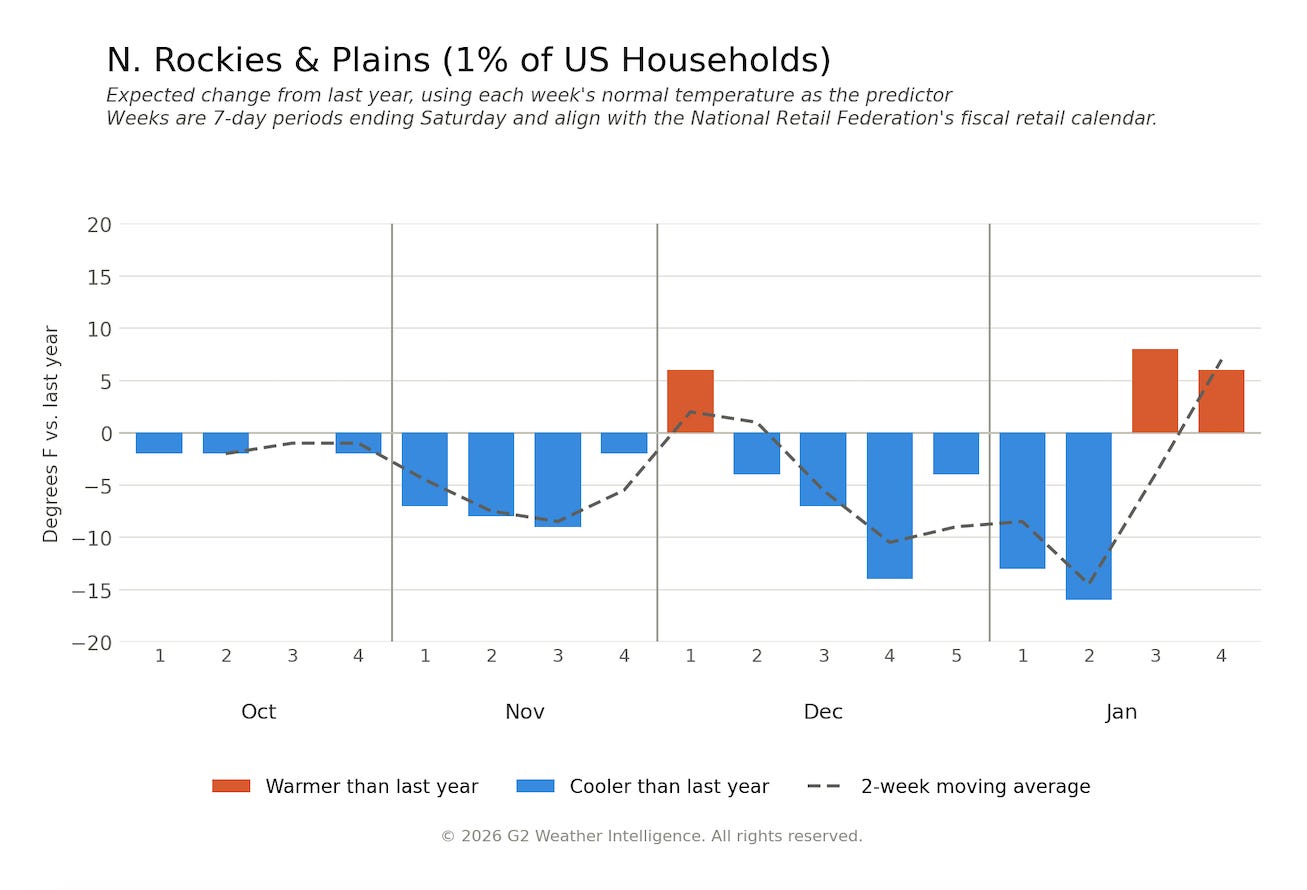
Three patterns in the year-over-year weekly comparison worth flagging for planning purposes (this winter vs. last winter, not vs. normal):
The swing isn’t gradual. Most regions show a sharp reversal from last year concentrated in the Thanksgiving-to-Christmas window, exactly where seasonal sell-through is heaviest.
Several regions show a second inflection in January — colder than last year early in the month, then a sharp warm swing by Week 4. That complicates post-holiday clearance timing specifically.
The geography doesn’t move as a bloc. The South carries the widest year-over-year swing in the dataset: an 18-degree colder plunge in late December versus last year, followed by a 15-degree warmer swing by late January. It’s also the region where the forecast’s precipitation signal, not temperature, carries the real operational risk.
The analysis and writing here are mine. I use Claude as an editor — for fact-checking and line edits — not as a source of ideas or content.
© 2026 G2 Weather Intelligence. All rights reserved