

In September’s Super El Niño Retail Call, I noted that a record-strength El Niño would leave cold-weather apparel exposed this holiday season, while the home sector and off-price chains would hold up.
Read the September call (paid subscribers) — The Super El Niño Retail Call: What a record-strength El Niño means for winter demand — and who’s exposed
This is the November update. September is in the books, the new outlooks are out … and the call holds.
Fall Started Late
September was the warmest on record for the lower 48, 4.6°F warmer than the 20th-century norm, beating the 1998 record (NOAA).
Weighted by households, about 84% of the country had a warmer-than-normal September. More than a third had their warmest September on record (132 years), including the Ohio Valley, home to 19% of U.S. households.
The nights were the bigger story.
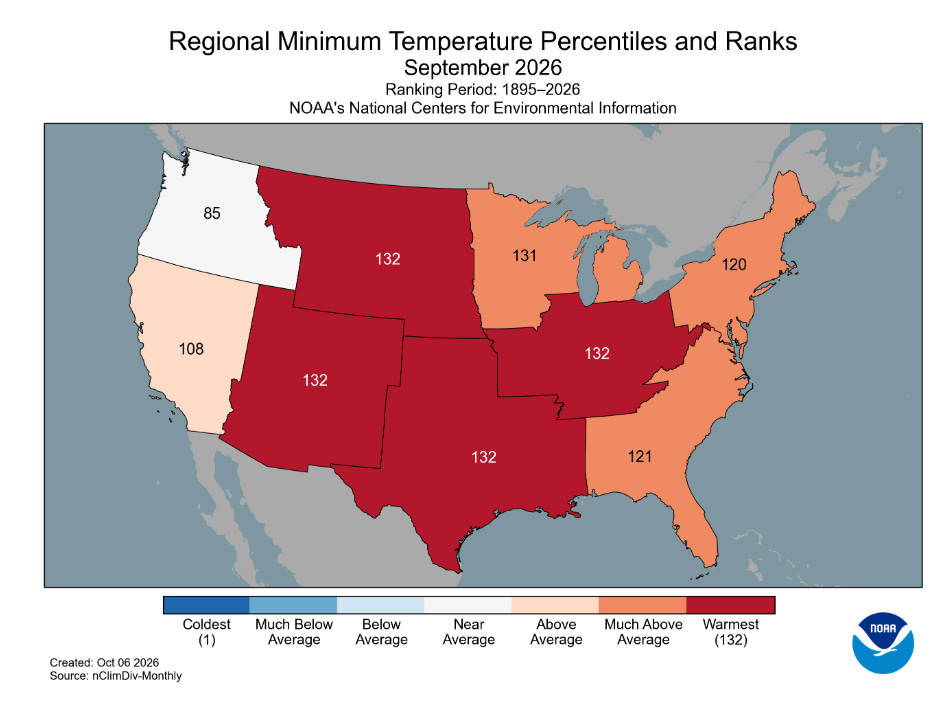
More than 30% of the lower 48 set records for warm September nights. People decide on a jacket, or whether to turn on the heat, by the morning temperature.
When the mornings stay warm, fall shopping waits, especially with inflation at 3.7% and shoppers in no hurry to buy what they don’t need yet.
That means slow fall apparel sales in September, and more pressure on October to catch up. If it didn’t, that inventory carries into the holiday quarter. Expect to hear “unseasonably warm September” on Q3 earnings calls next month.
El Niño’s grip on U.S. weather is strongest in winter, so September is less about El Niño than about how warm the starting point already is.
October’s numbers will come out in early November, and I’ll update then, ahead of Q3 retail earnings.
The November Outlook Confirms It
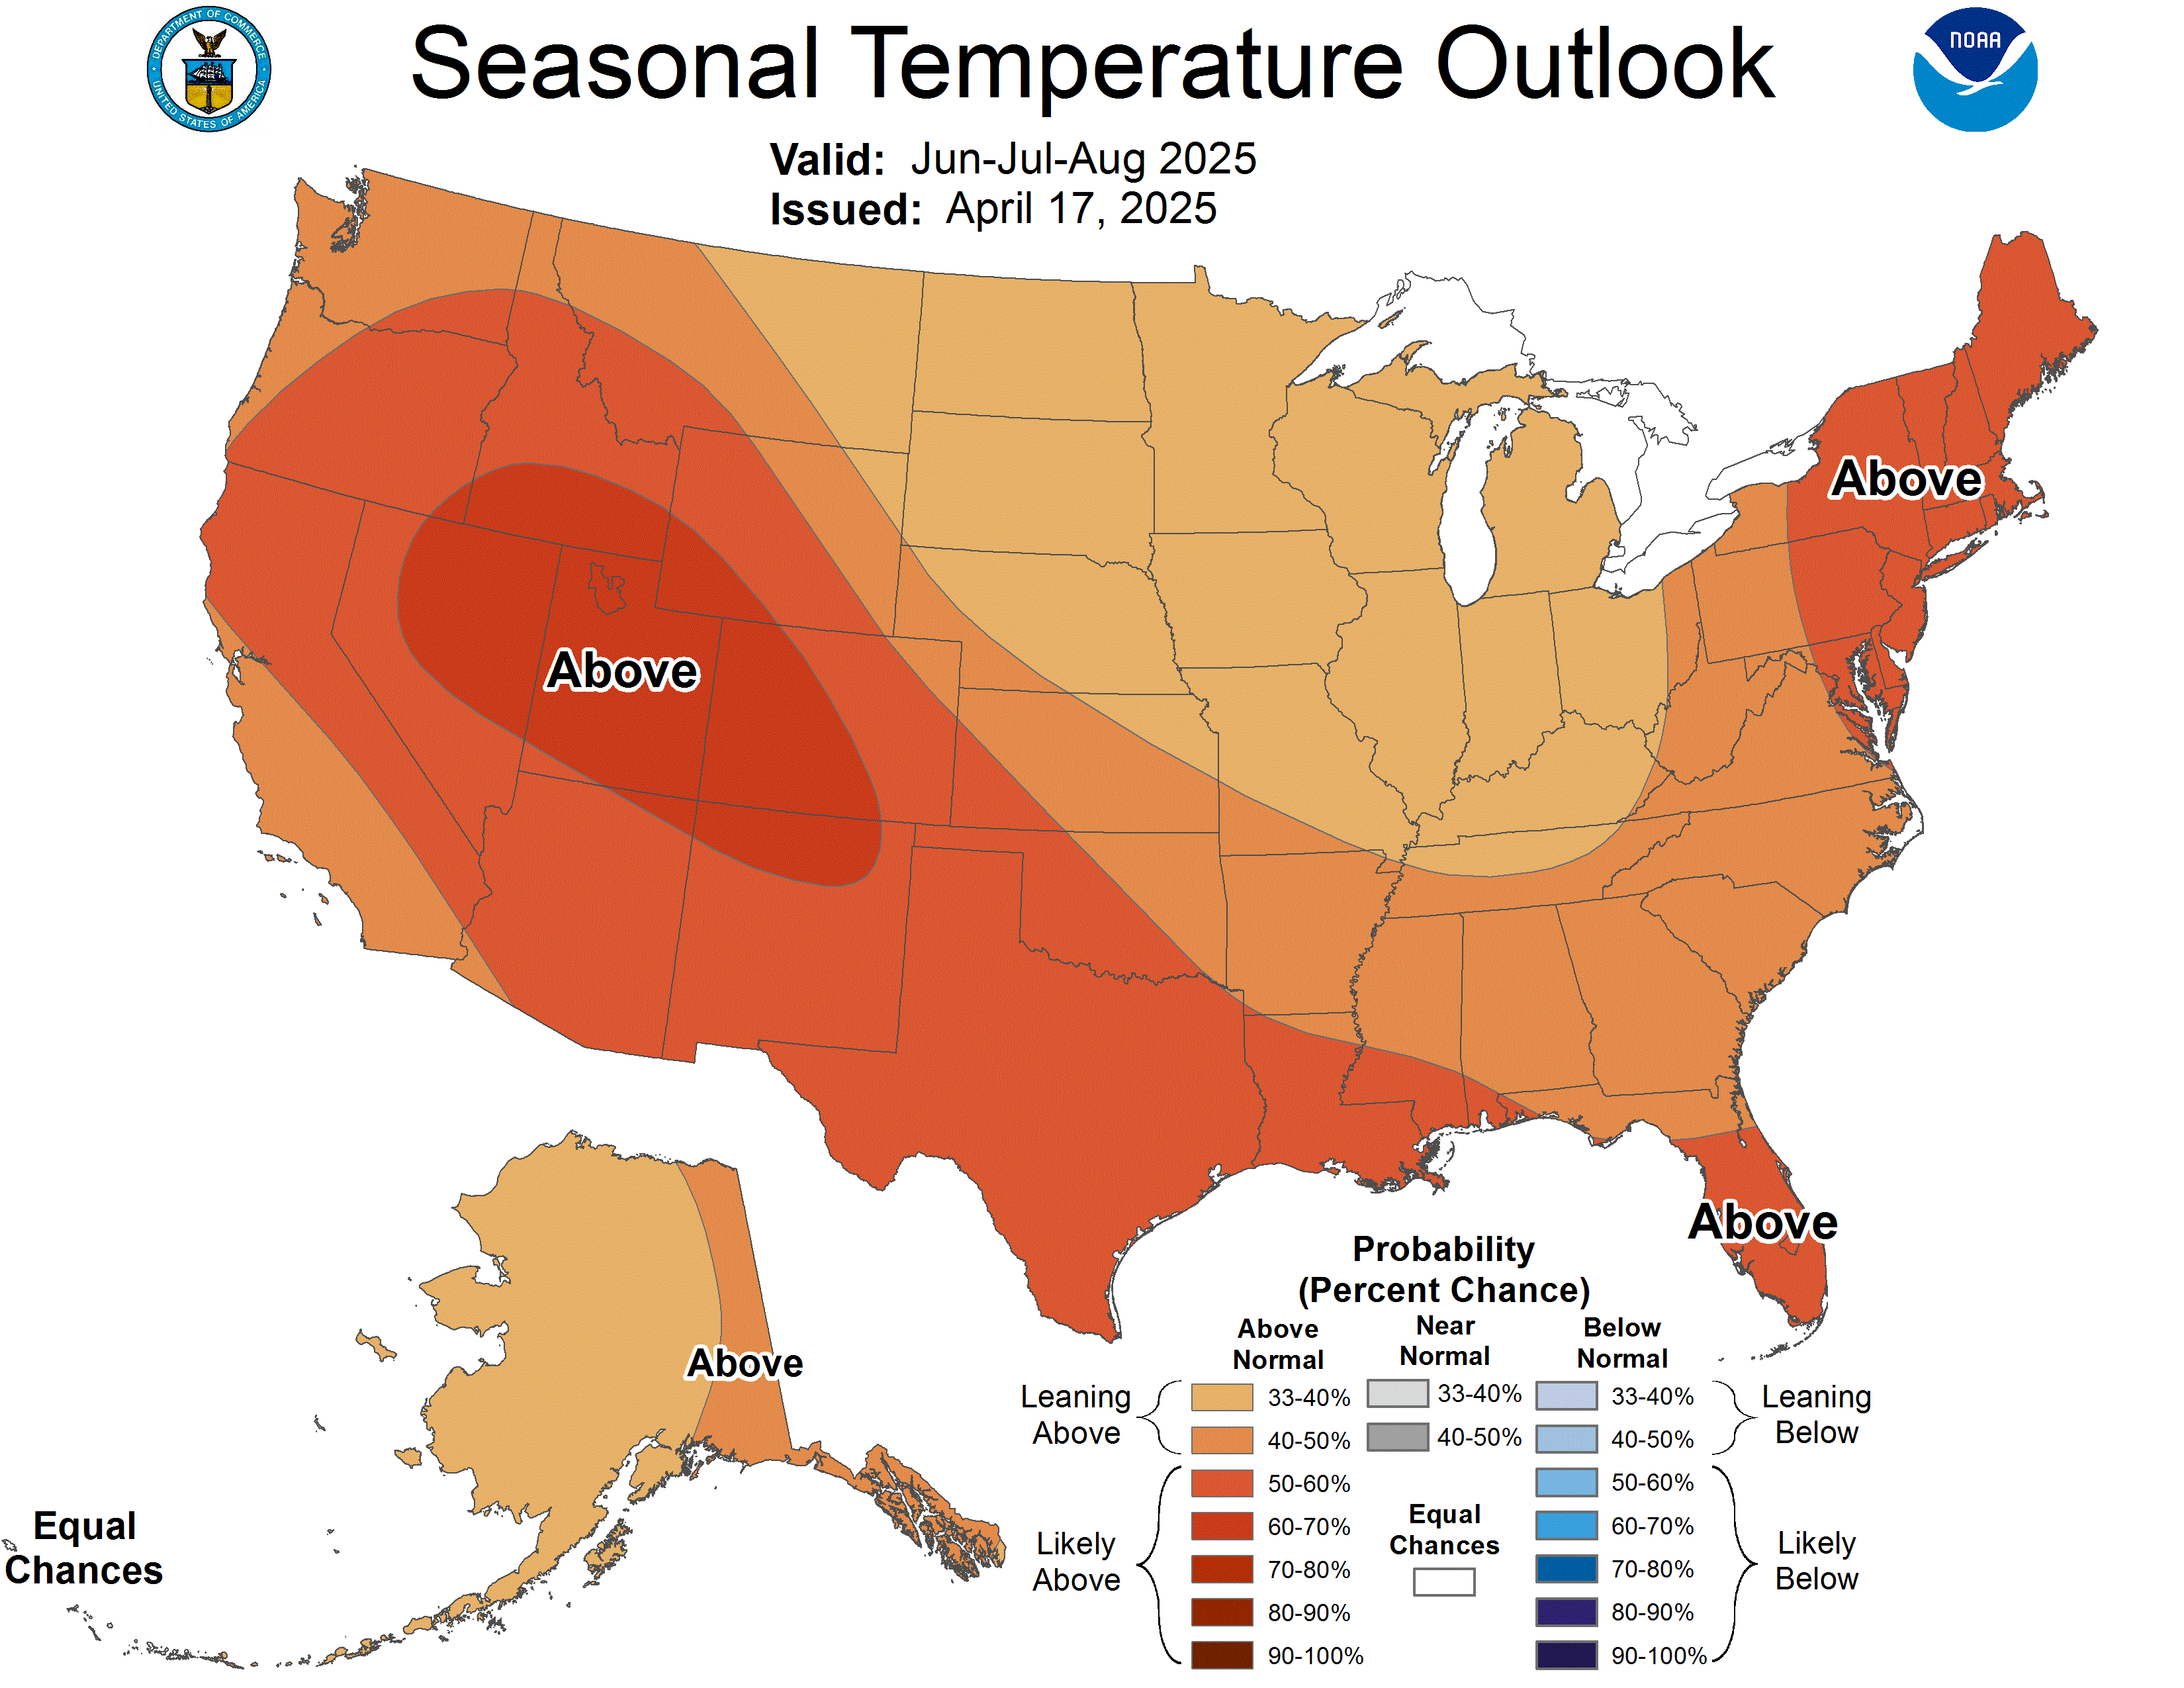
NOAA’s winter outlook, released last week, carries the classic El Niño signature: warmer than normal across much of the North, wetter than normal across much of the South.
The initial November outlook shows the same pattern up close.
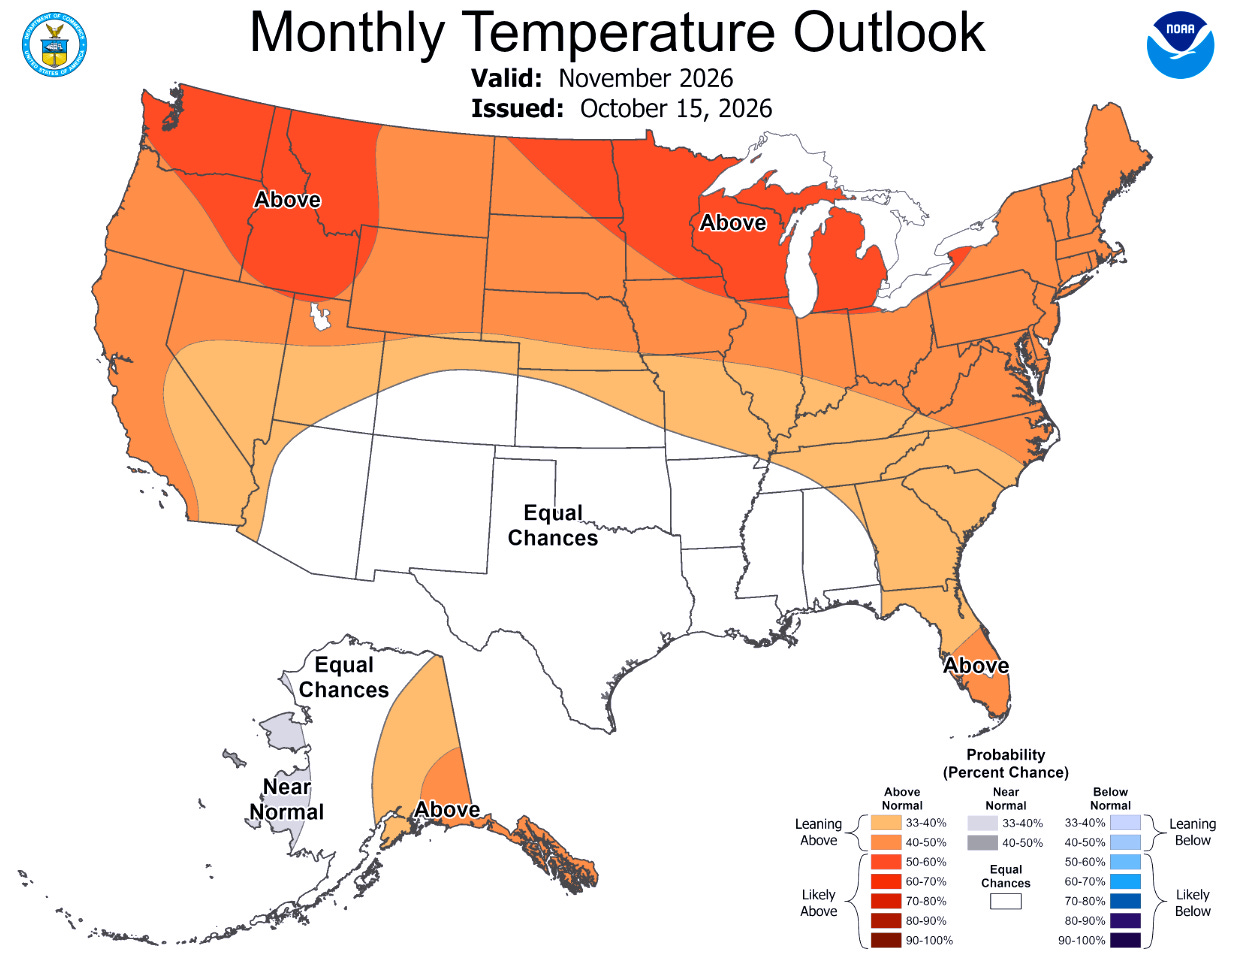
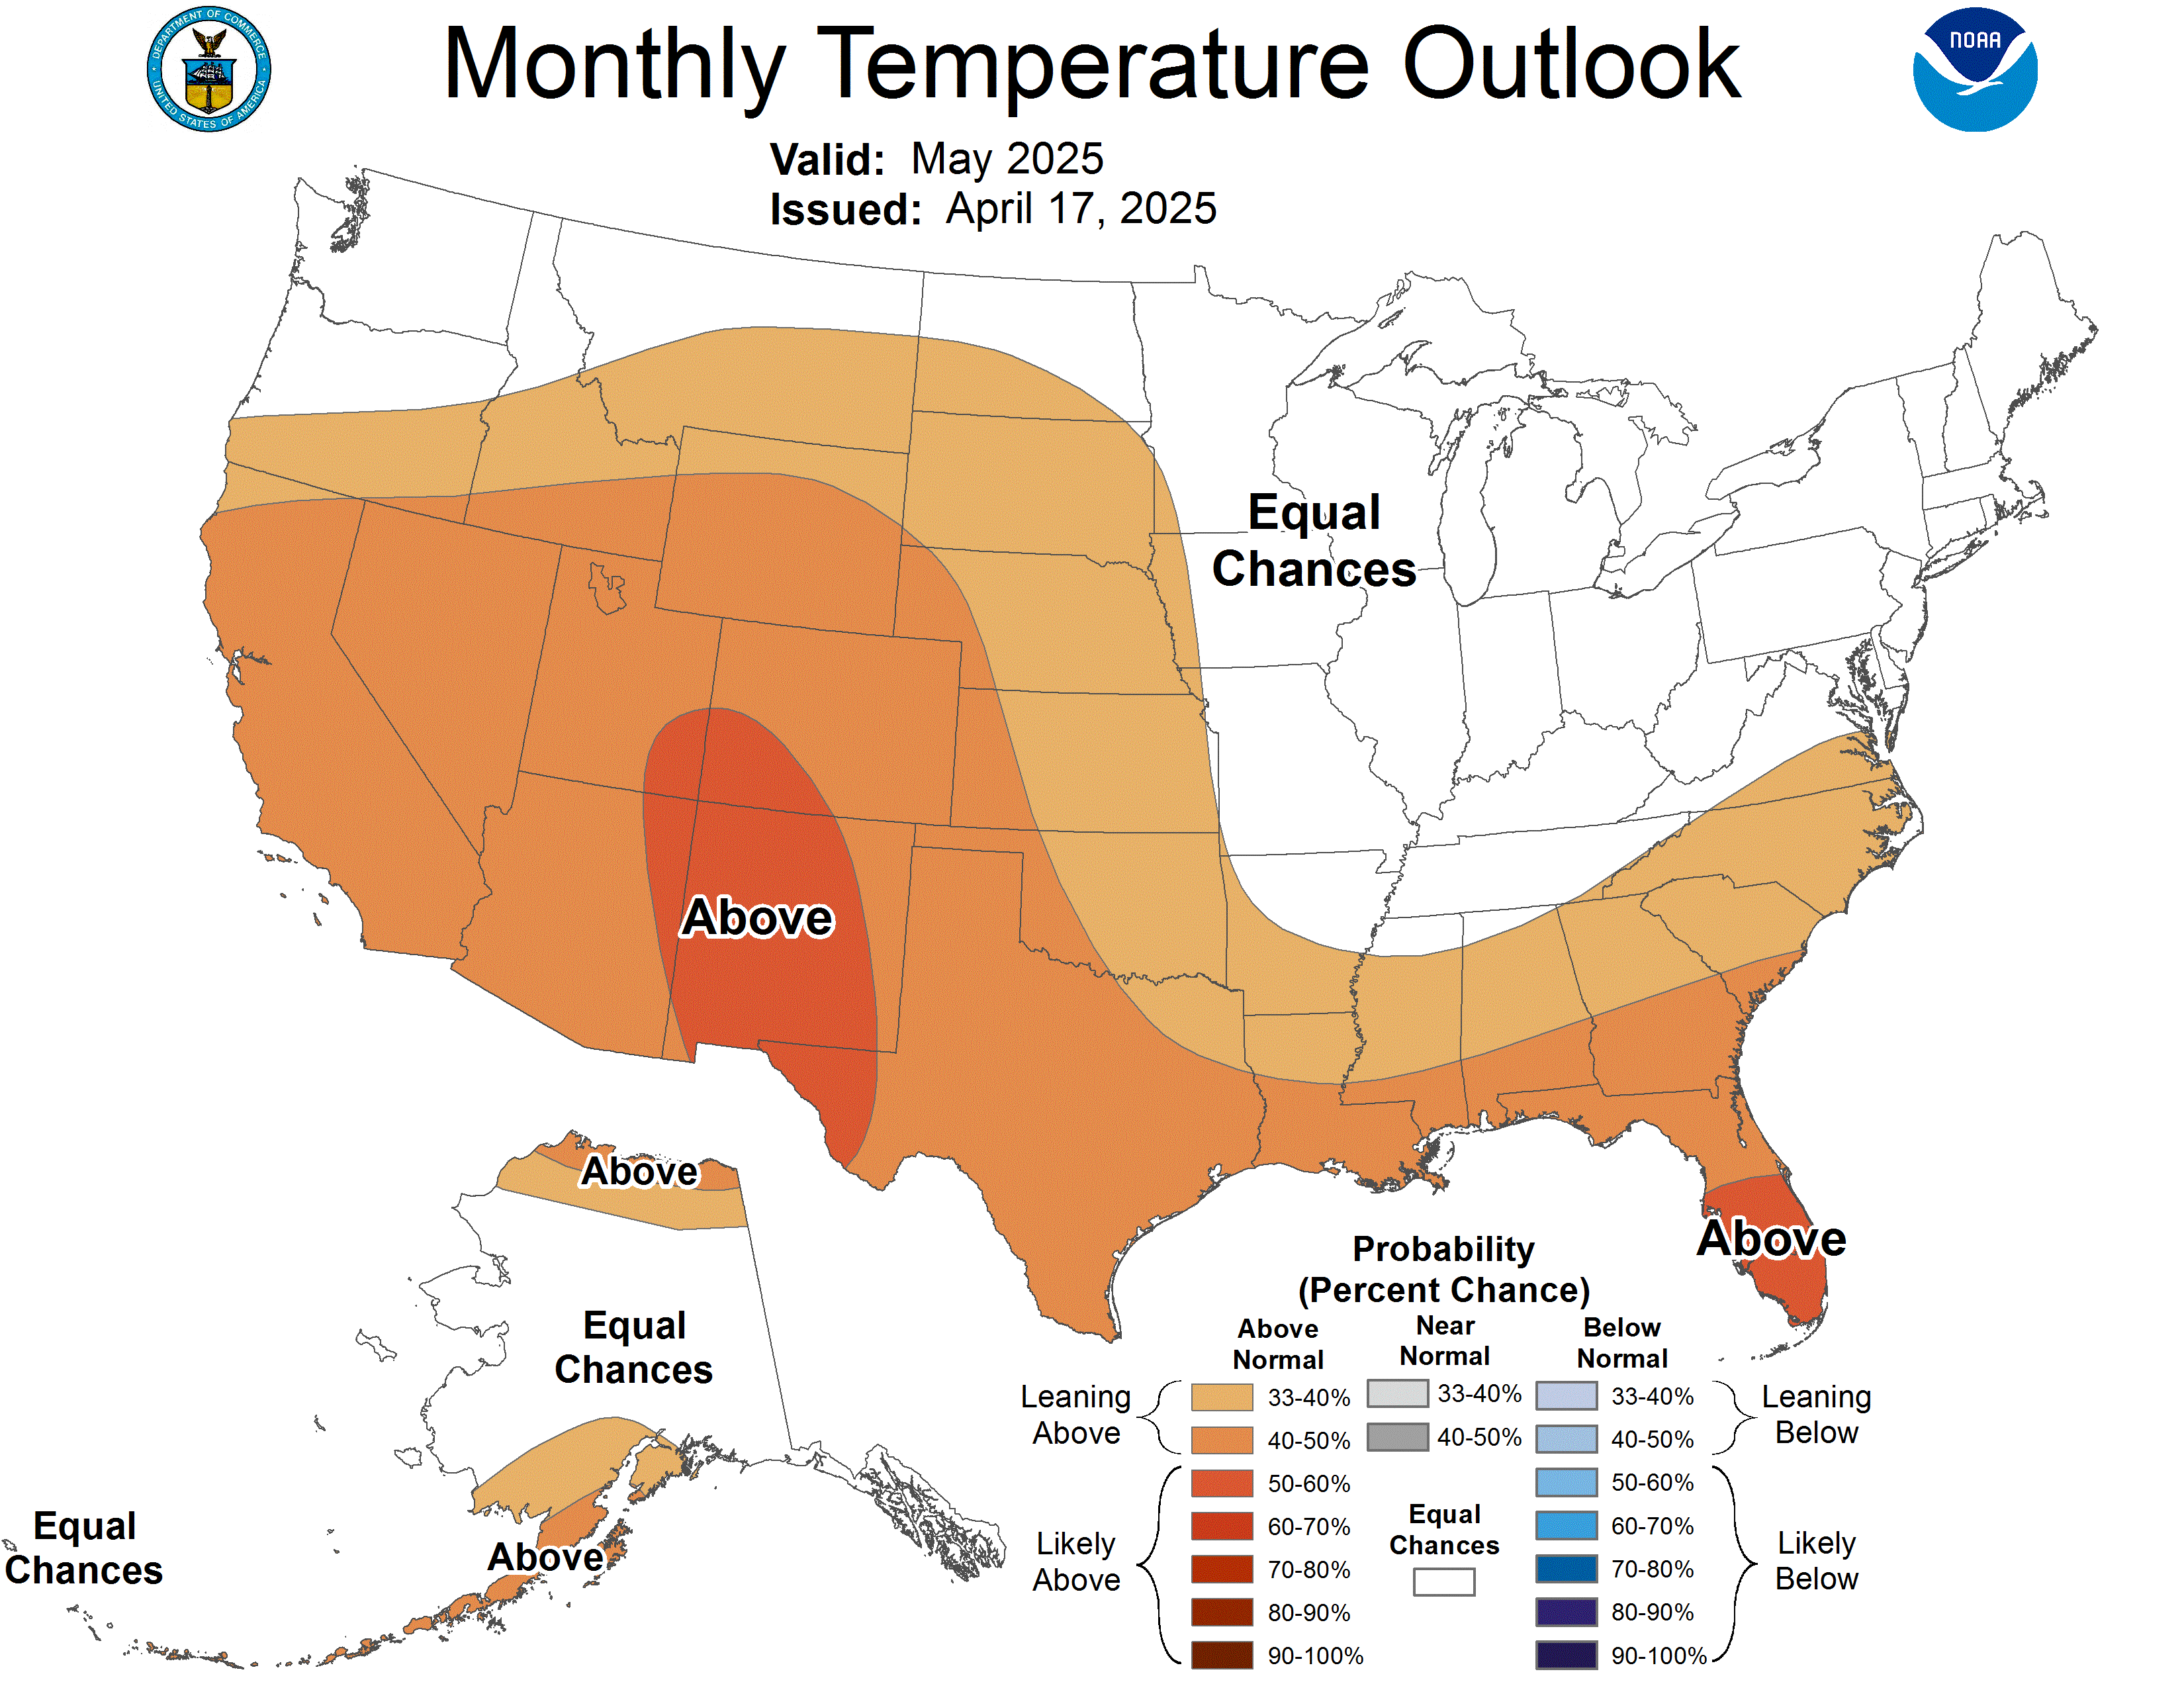
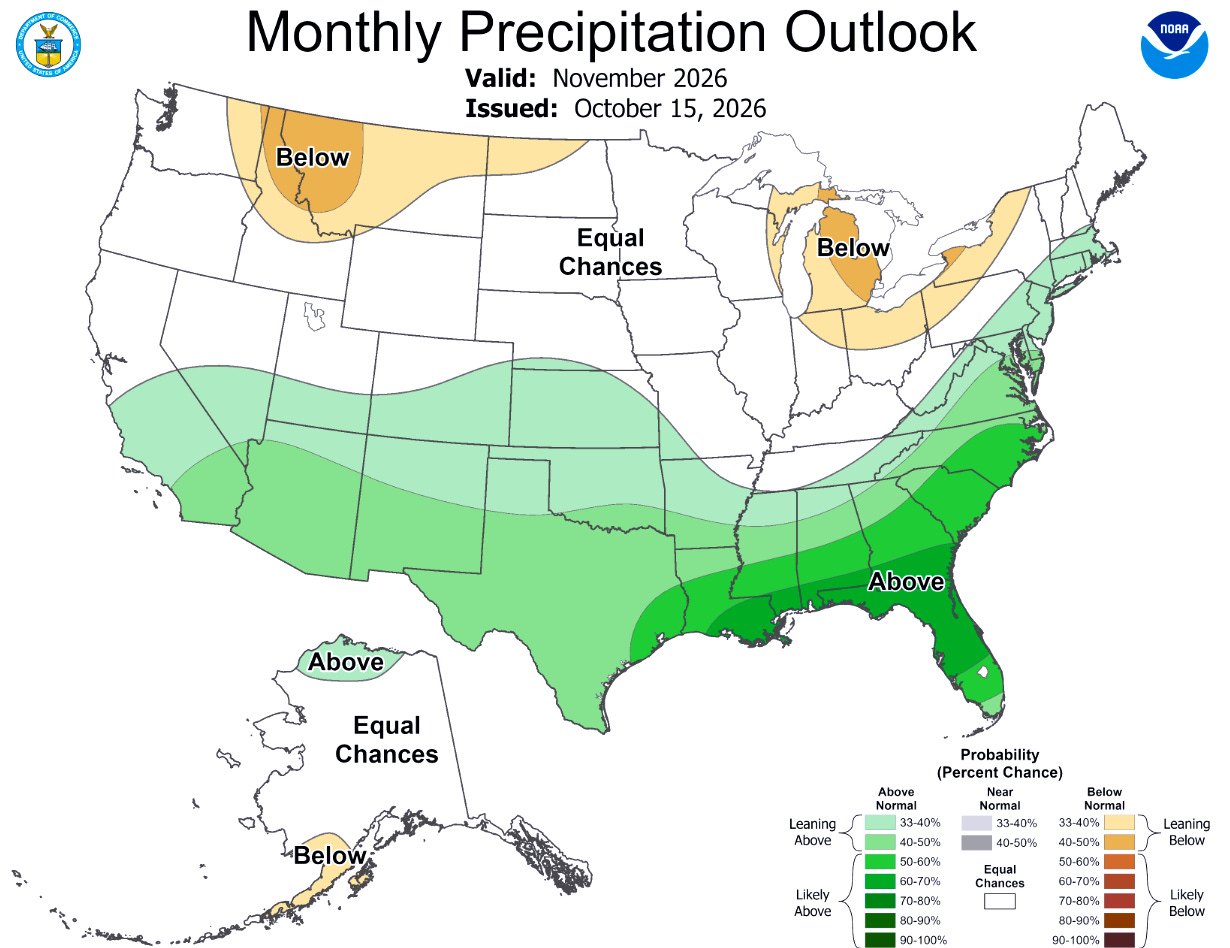
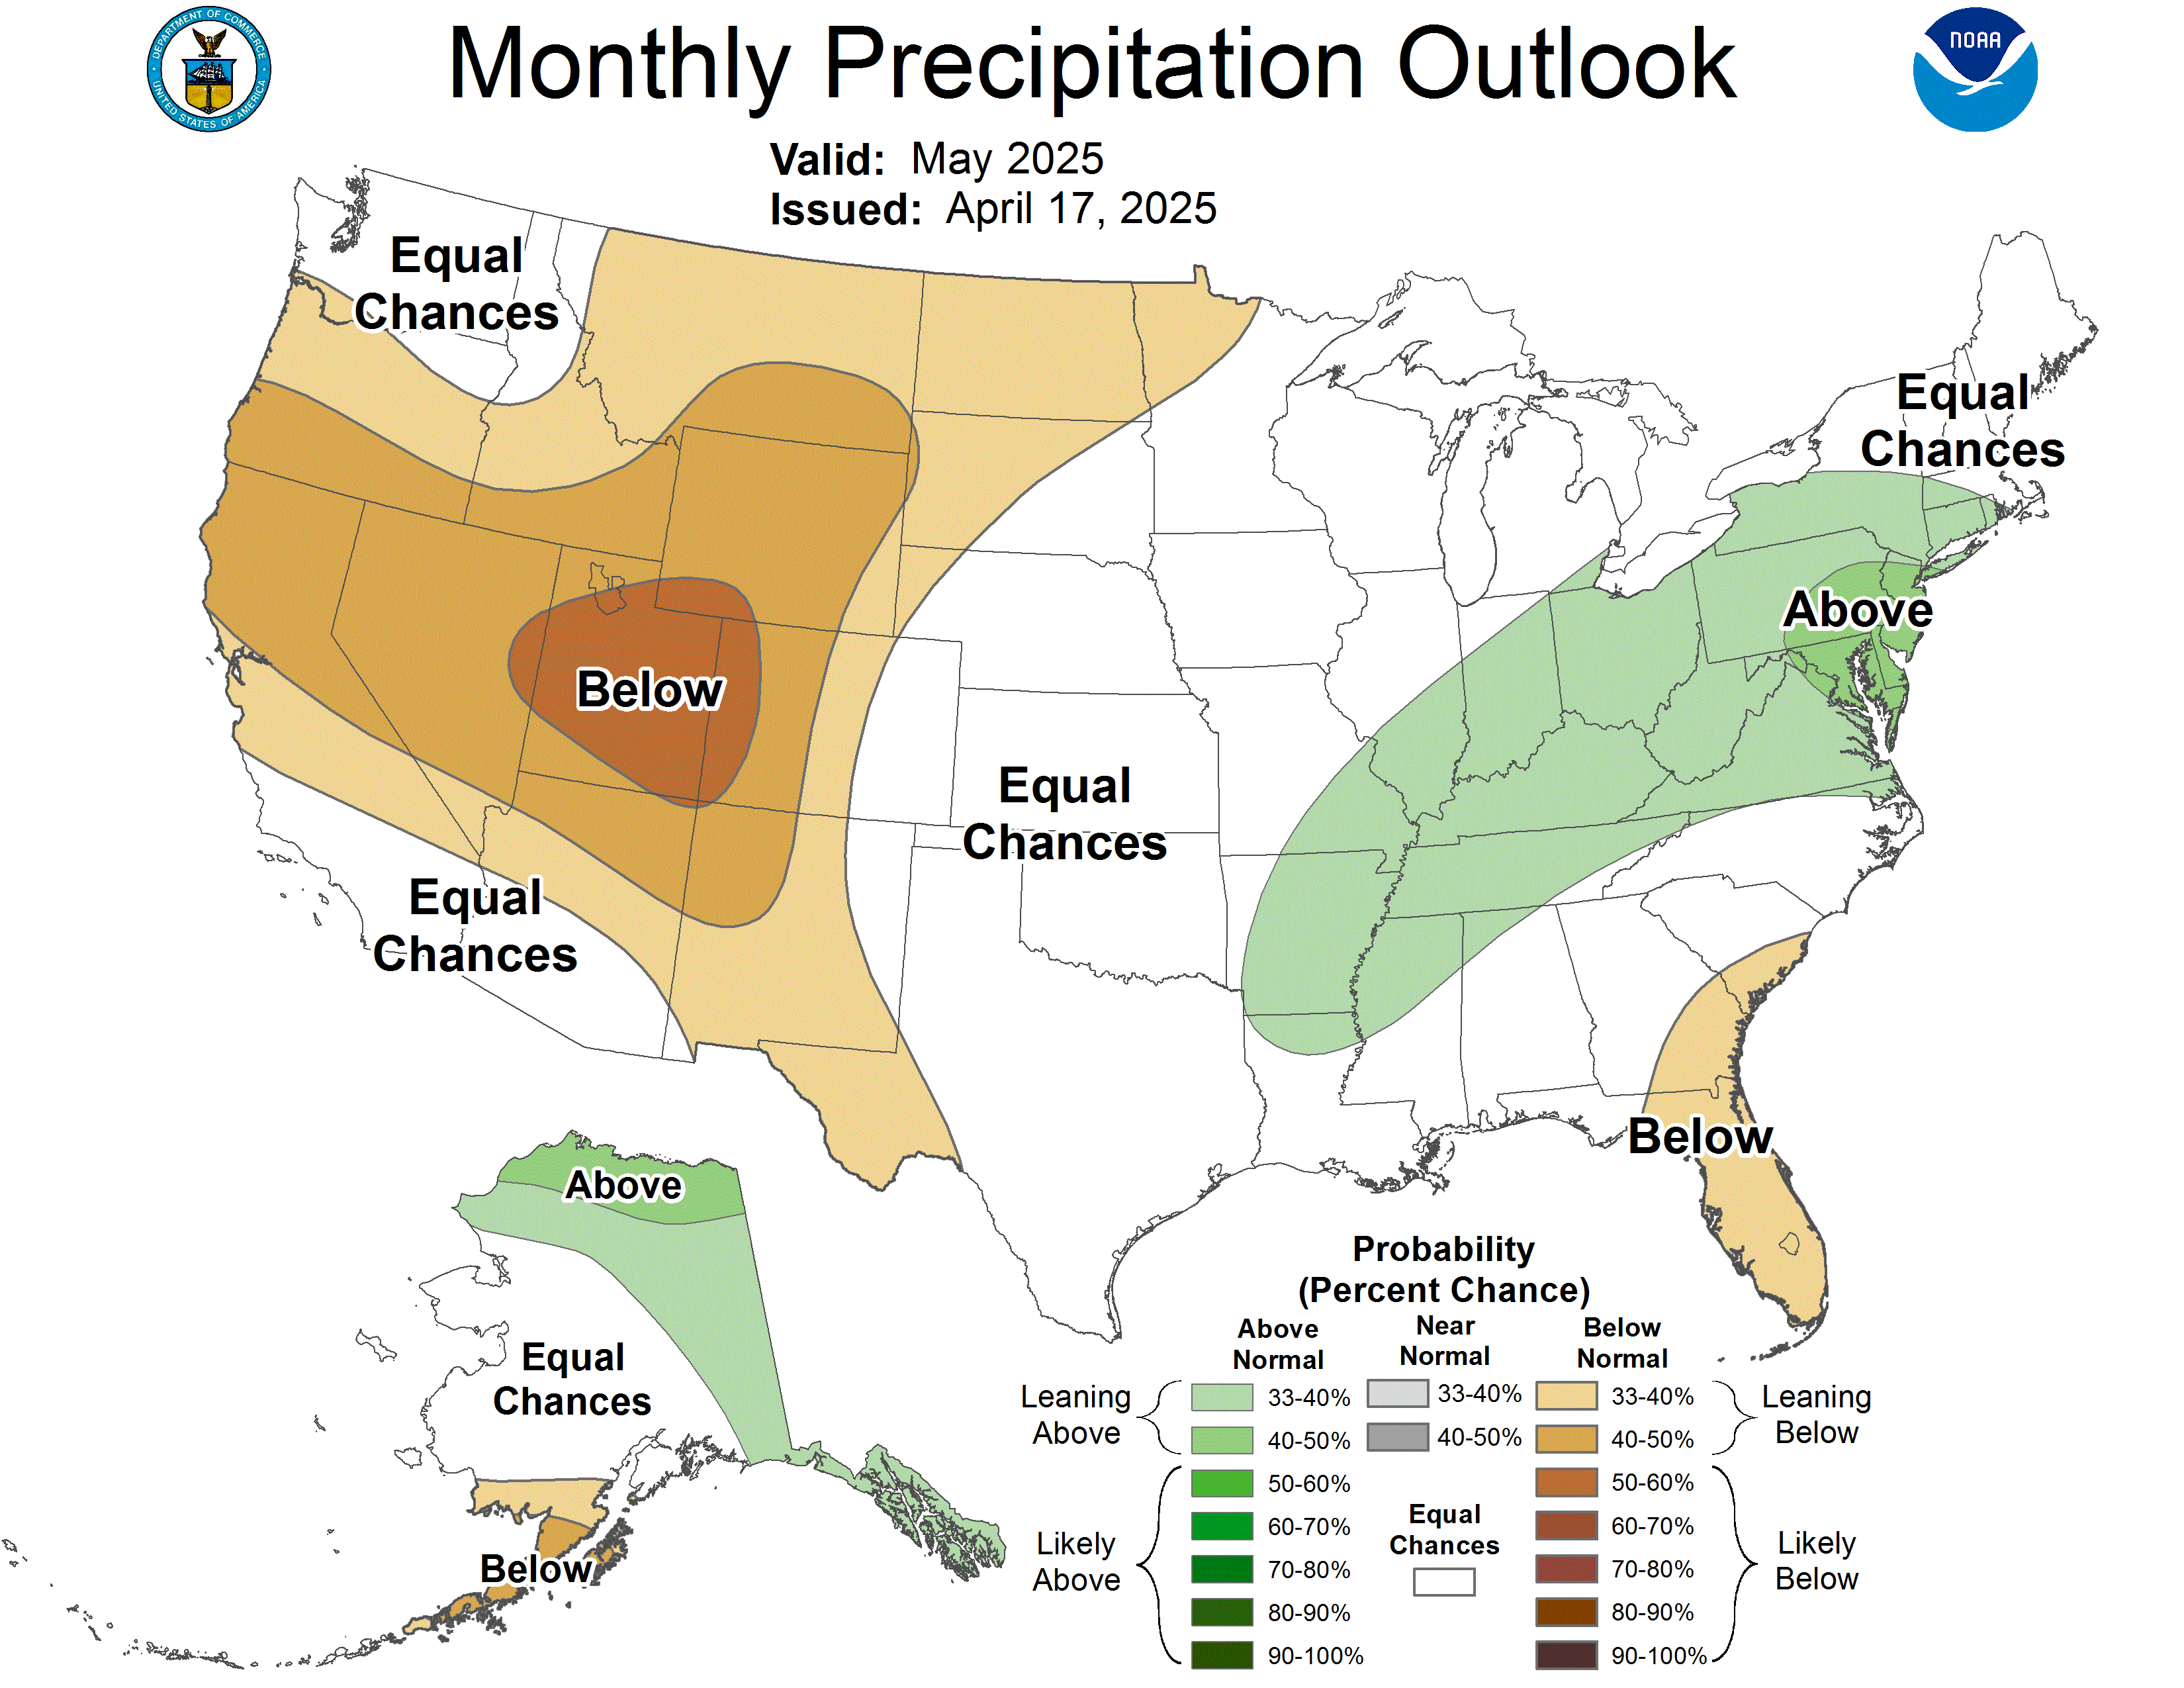
How to read the maps: NOAA splits every month into three categories, colder, near, and warmer than normal, each with a one-in-three chance in a typical year.
When the odds of warmer rise, as they do across much of the North, and near normal holds at about a third, the odds of a colder month shrink to whatever is left.
The Holiday Quarter, Week by Week
This is a November update, but the charts below run through January.
Here’s why: Most retailers plan on the National Retail Federation’s retail calendar, which divides the year into four 13-week quarters, with every week ending on a Saturday, so this year’s weeks line up with last year’s.
The holiday quarter, retail’s Q4, runs from early November through late January: four weeks in November, five in December, and four in January. January counts because that’s when retailers clear out what didn’t sell.
So the charts go week by week through the whole quarter, comparing each week with the same week last year.
That’s how merchants see the season.
Two regions flip from last year: the Northeast and the South, home to about a third of U.S. households.
The Northeast (22% of U.S. households): headwinds for apparel, a lift for home
Last November officially ranked near normal, but the warmer climate made it feel colder than in recent years. I can attest to that … I lived through it.
A “normal” November, measured against the 1991–2020 average, feels a lot colder to those of us who live here and have grown used to milder Novembers.
This far out, no forecast can tell you what any single week will look like. Day-to-day forecasts lose their skill after about two weeks. At this range, the best weekly forecast available is a reversion to the mean: assume each week comes in at its normal temperature.
The chart below does exactly that, then compares each week with what actually happened in the same week last year.
Even with just normal weather, the Northeast runs warmer than last year in 10 of 13 weeks. The biggest swing comes in the first two weeks of December, about 8–10°F warmer than last year, right when holiday selling peaks.
January turns colder in week 2, then sharply warmer by week 4, which complicates clearance timing.
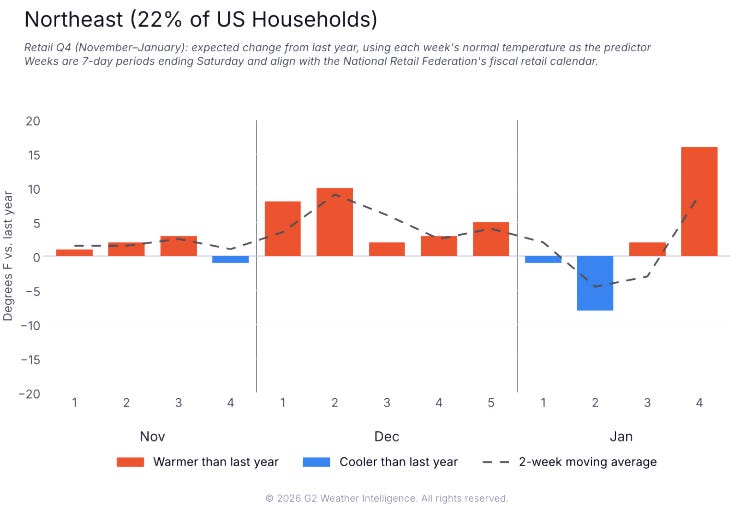
And normal is the conservative case. NOAA puts the Northeast’s odds of a normal-or-warmer November at roughly 75–80%, leaving only about a one-in-five chance of a cold one.
Add those odds to the chart, and confidence grows that the Northeast’s holiday quarter runs well warmer than last year, likely by more than the chart shows.
For specialty apparel and department stores, that means weaker demand for coats, sweaters, boots, and cold-weather accessories. Winter seasonal items like ice melt and snow shovels face the same headwind.
For the home sector, milder weather is a plus, because outdoor projects run later into the season.
Consumers get a break, too. Less cold means lower heating demand than last year, which helps offset the high price of heating oil, the fuel many Northeast homes rely on.
The South (12% of U.S. households): the winter opportunity
Last November was the warmest on record across Texas, Oklahoma, Arkansas and Louisiana, and so was this September.
Using the same method, normal weather for each week against what actually happened last year, the South runs cooler than last year in 10 of 13 weeks.
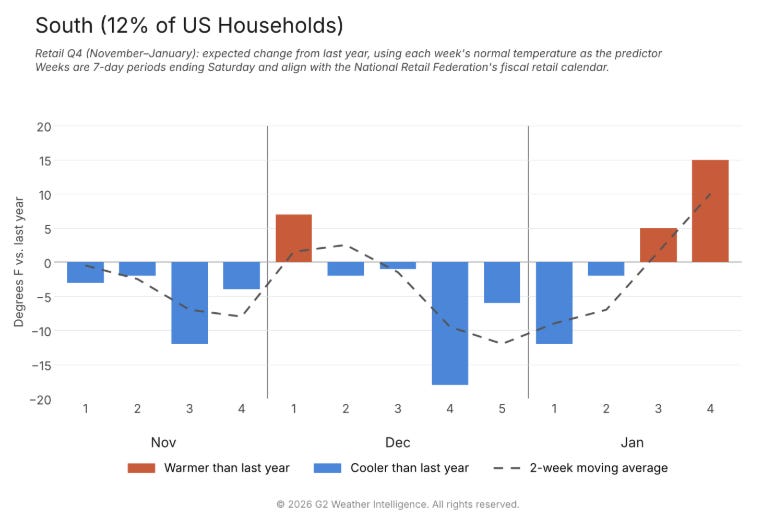
Every November week comes in cooler. Christmas week runs about 18°F cooler, the biggest swing in the data. Late January is the exception, turning warmer than last year.
Here the odds don’t change the picture. NOAA shows no lean toward warm or cold for November, so another warmer-than-normal month is about a one-in-three chance, and matching last year’s record is far less likely.
For coats, sweaters and other cold-weather items, that’s the easiest comparison in the country. After a record-warm November, even an ordinary one gives shoppers a reason to buy.
The catch is rain. The Gulf Coast’s wet signal is the strongest on the map, and rain keeps shoppers home even when it’s cool.
The analysis and writing here are mine. I use Claude as an editor — for fact-checking and line edits — not as a source of ideas or content.
© 2026 G2 Weather Intelligence. All rights reserved.